

Quickly Find The Best Trading And Value Betting Opportunities Each Day
We’ve recently added a new feature to Predictology which we are sure is going to make a HUGE difference to your daily betting and trading routines.
With one click of a button you can now instantly get an easy to use report identifying some of the best trading opportunities and the matches with the greatest value betting potential.

Where To Find The Daily Trade & Value Betting Sheet
Simply log into your account on Predictology.
Go to the menu option for Match Analysis
Select the Menu Option – Daily Sheets & Reports

What Can You Access?
You can access all performance data, insights and results going back to May 2019. So we already we have more than 7 months of data, spanning over 12,000 matches and this is increasing daily.
In addition to this, you are also able to export the data for up to a week ahead which means you are able to quickly identify potential trading and betting opportunities for the week ahead. Although, we recommend only focusing on the the current and following days if using any of the AI recommendations, as these are subject to change in the lead up to games. This is due to the live nature of odds and other factors built into our proprietary AI algorithm.
Please also note that you can export a maximum of one months data at a time due to the file sizes but there is nothing to stop you export multiple months, one after another. It will only take a few minutes to export each file and then you can quickly add them into one sheet for further analysis.

How To Use The Report
There are almost limitless ways in which you can use the sheets and we’ll cover some examples here. However, you are not limited to these examples and we are positive you will be able to come up with your own angles as well.
Remember, these sheets can be used in a variety of ways. Some of our team here have developed some simple yet powerful filters and will follow any matches that get shortlisted. While other members of the team use these as sign posts and then will focus on trading in-play if the match develops in the way indicated by the report.
Firstly, we will go over some of the main sections of the reports before covering in detail some example strategies and approaches
Report Breakdown
– Main Match Details
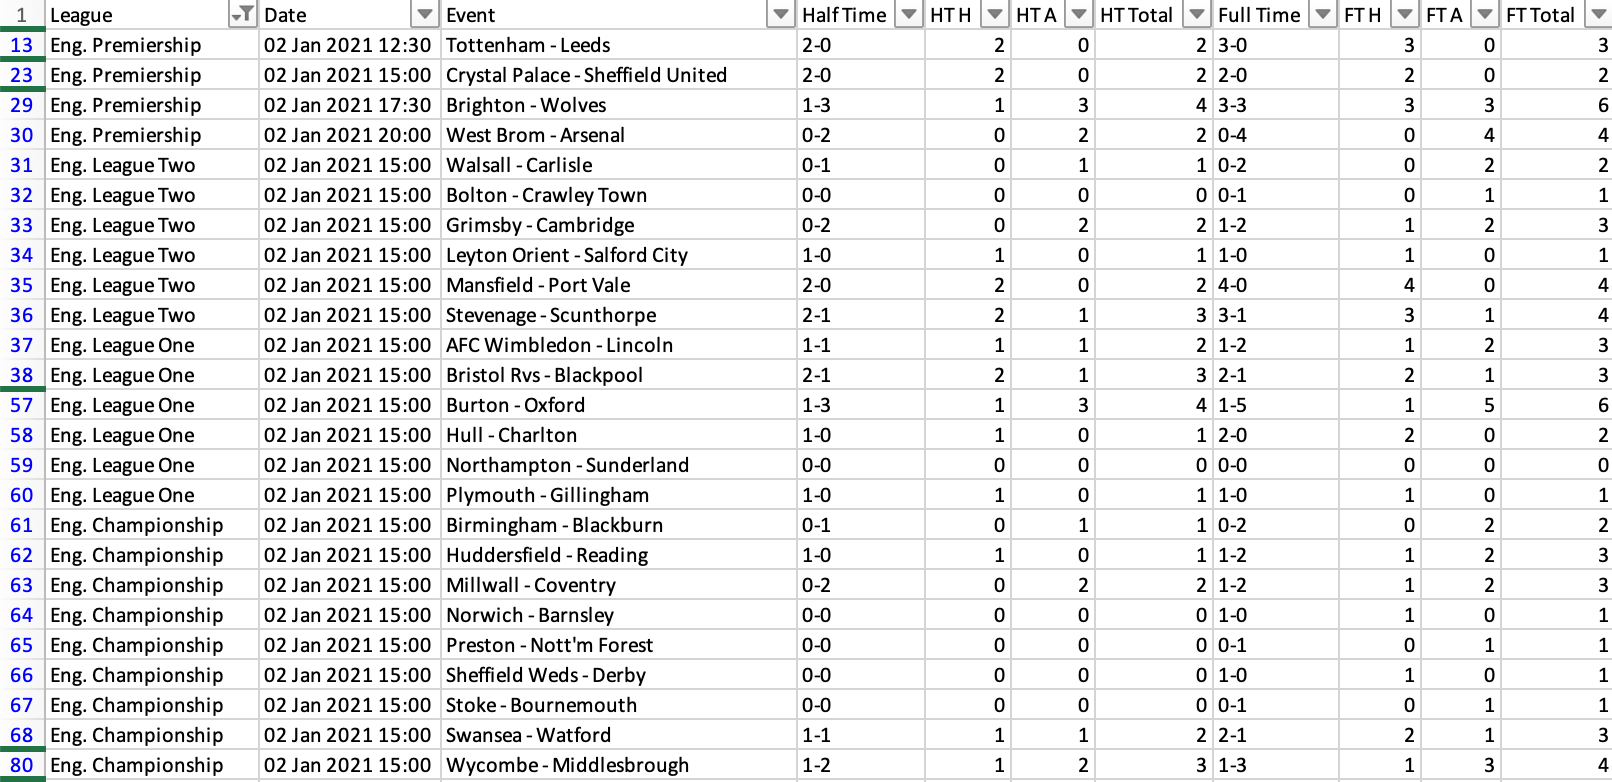
This section is pretty self explanatory. It includes all the pertinent match information such as fixture details, league, date and kick off time.
Post match you can also easily check the score and goal information, including first half and second half goals, and the goals scored by each team.
– Match Probabilities and Recommendations
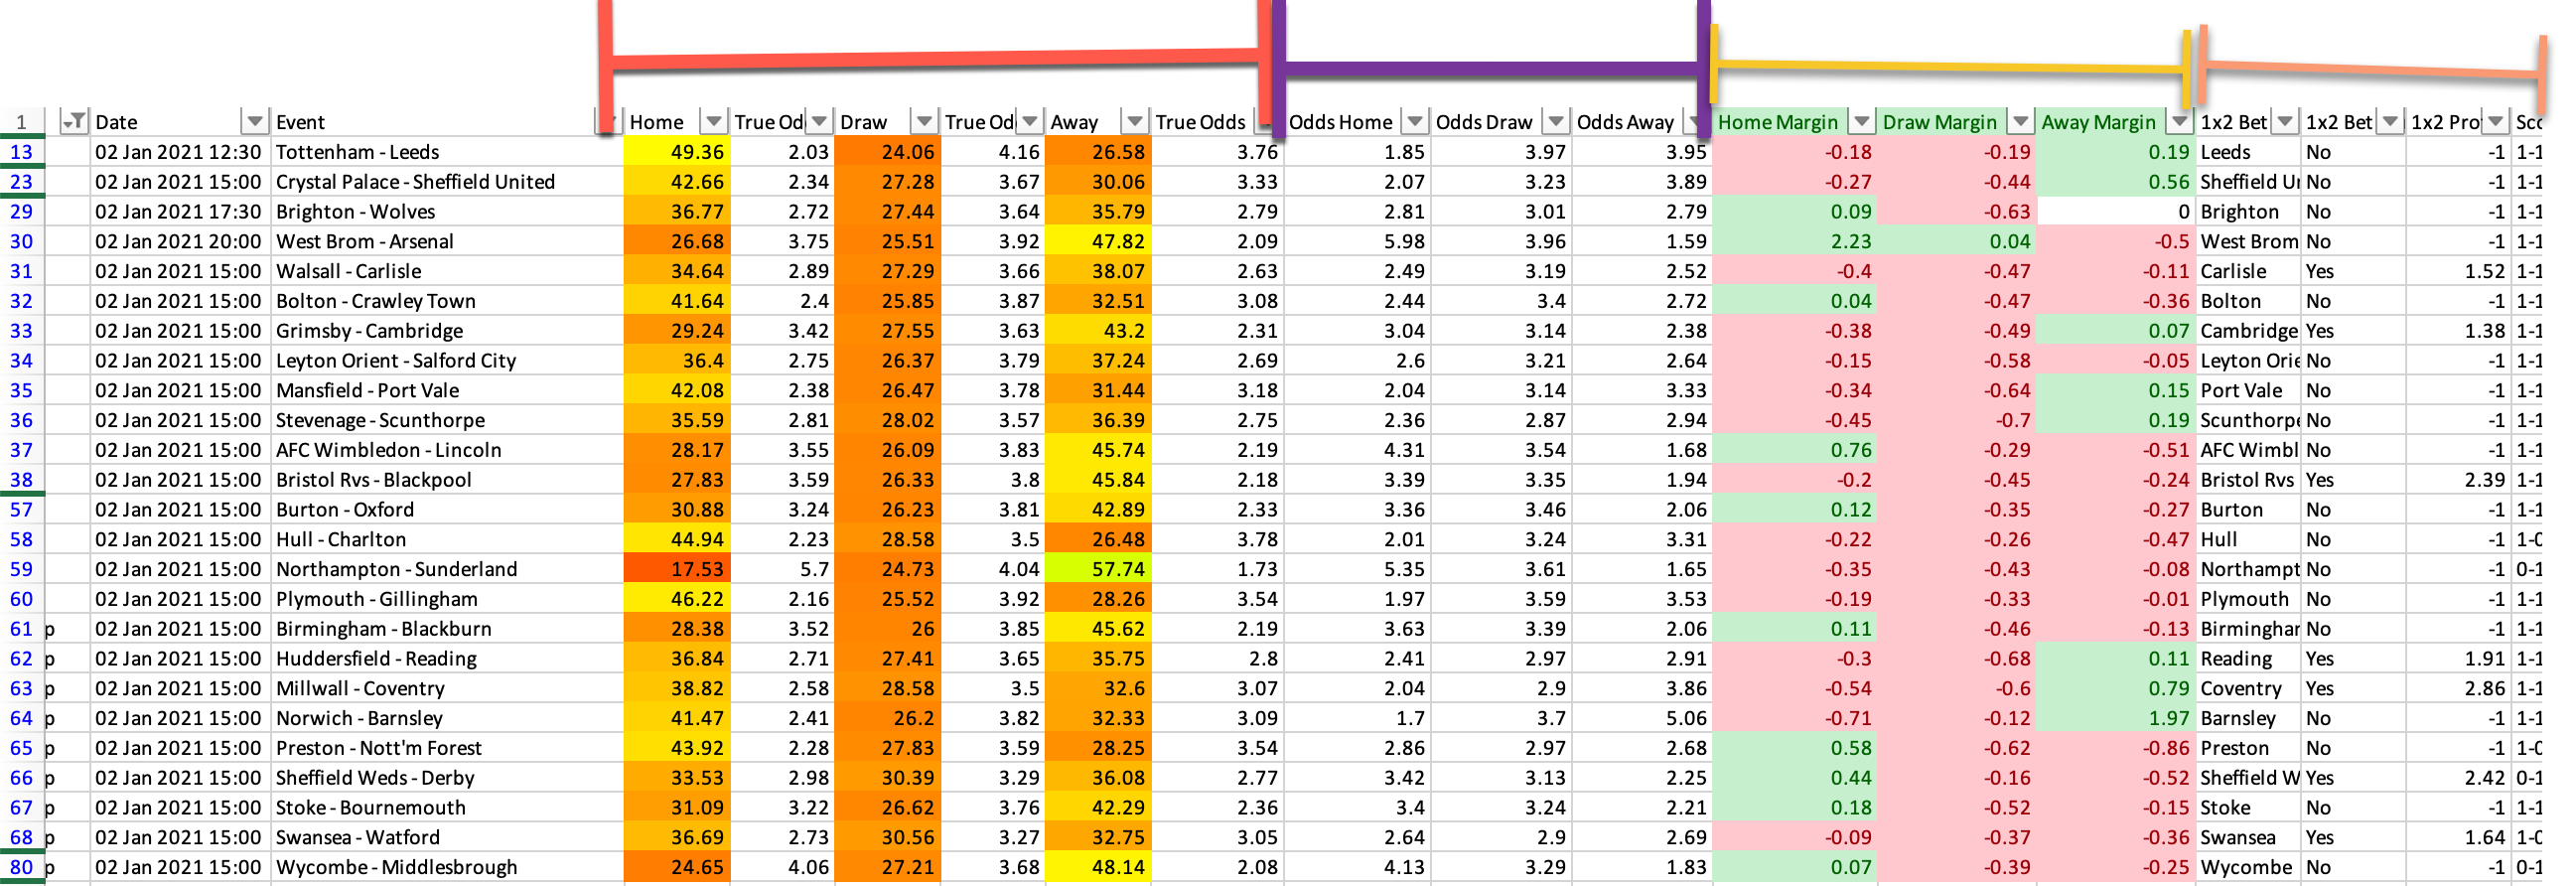
Red – in this section you can see the percentage probabilities assigned to each match for the match outcome as determined by internal AI algorithm. (remember this is based on 100’s of thousands of games).
We have also converted these probabilities into decimal odds to for easy reference on what we determine the “True Odds” to be on any outcome.
Purple – This shows the live betting odds for each market. These are based on the average available price across 20+ bookmakers.
Yellow – This section looks at the expected “true odds” and what the current available ‘live odds” which are available. If the ‘live odds” are higher than the expected true odds then this is a strong indicator of value. We highlight these as a positive figure (green) in this section of the report.
Orange – In the final section of this example, we can see the recommendations made by the AI algorithm for each match based on identifying value in the market.
The Predictology team use this section frequently in a number of ways. Here are just a few examples for you to consider.
1. Identify games with a high probability of a winning team.
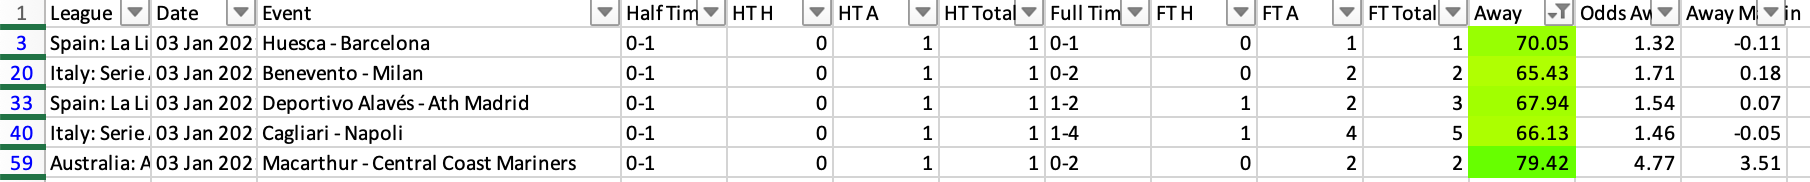
In the example above, I have simply looked at all away sides that have a 65% or higher probability of winning their games.
Since January 1st, this has indicated 5 games. All five games were won by the away side, as predicted.
But the one game in here that really caught my eye was the Macarthur vs Central Coast Mariners game in the Australian A League.
It is very rare to see any game with a near 80% probability and not only that, the price on CCM was huge at nearly 4/1.
Now, I was aware that Macarthur were a new addition to the A League, and had won their first game, so it’s important in this case to do a little research or, as I did, wait until the game has started and then make an assessment.
I waited until around the 25th minute and CCM looked the stronger team and I was no happy to enter the market.
I split my stake across CCM in the Match Odds market, CCM to win the first half at 5/1 and then a small lay of Under 0.5 First Half Goals incase the goal went to the home side first.
Ten minutes later, CCM took the lead and I was able to trade into a profitable position. Final result? 0-2 to Central Coast Mariners.

2. You can also use this data to identify a potential upset.
I know one of the team here uses a simple, but very effective approach. He quickly looks for away sides that are odds on and then if our AI engine is predicting anything but an away win, then he will consider a lay bet on the away favourite.
The obvious example to give you is the recent Southampton vs Liverpool game.

Our AI had Liverpool down as a little better than a 50 / 50 chance to win the market yet the live odds had them priced at 1.50. So a huge discrepancy in the pricing and potential value.
Furthermore, our AI felt that this game was most likely to end in a draw. Another model that we have (not shown) also indicated a Southampton win, so it was a pretty easy decision to place a lay on Liverpool and a smaller back on Southampton.
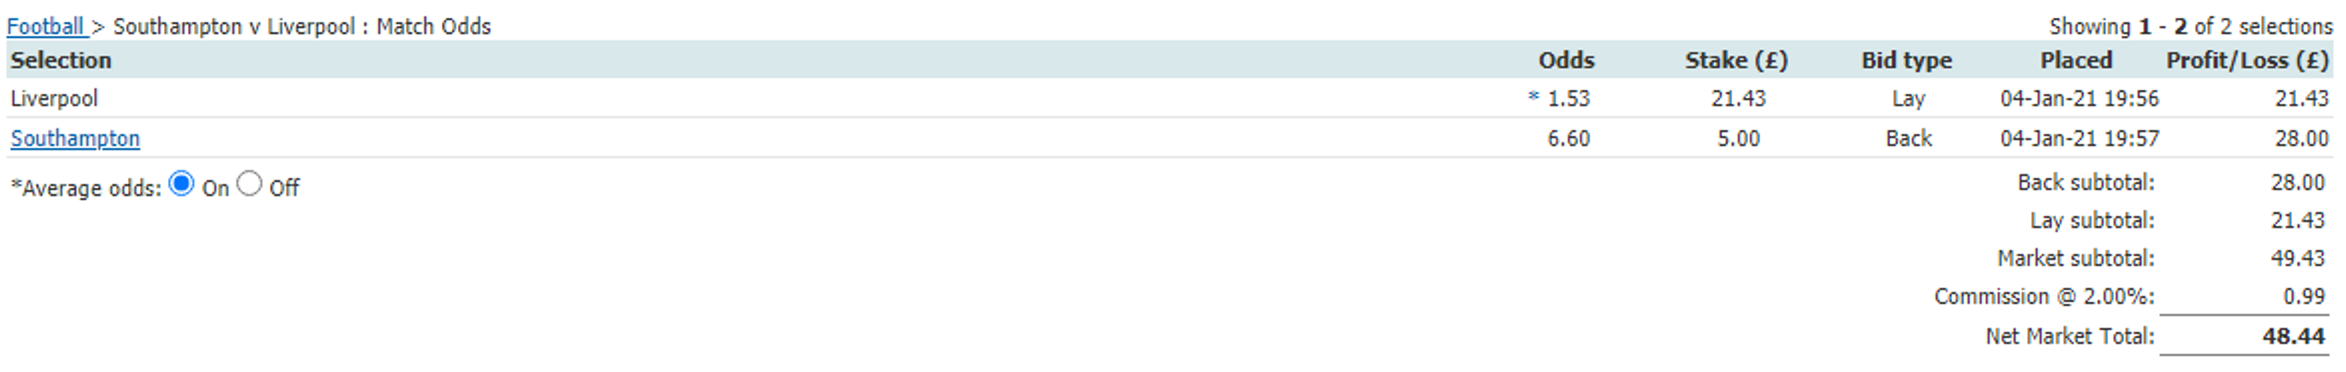
Another excellent collect thanks to the AI algorithm.
– Goal Recommendations
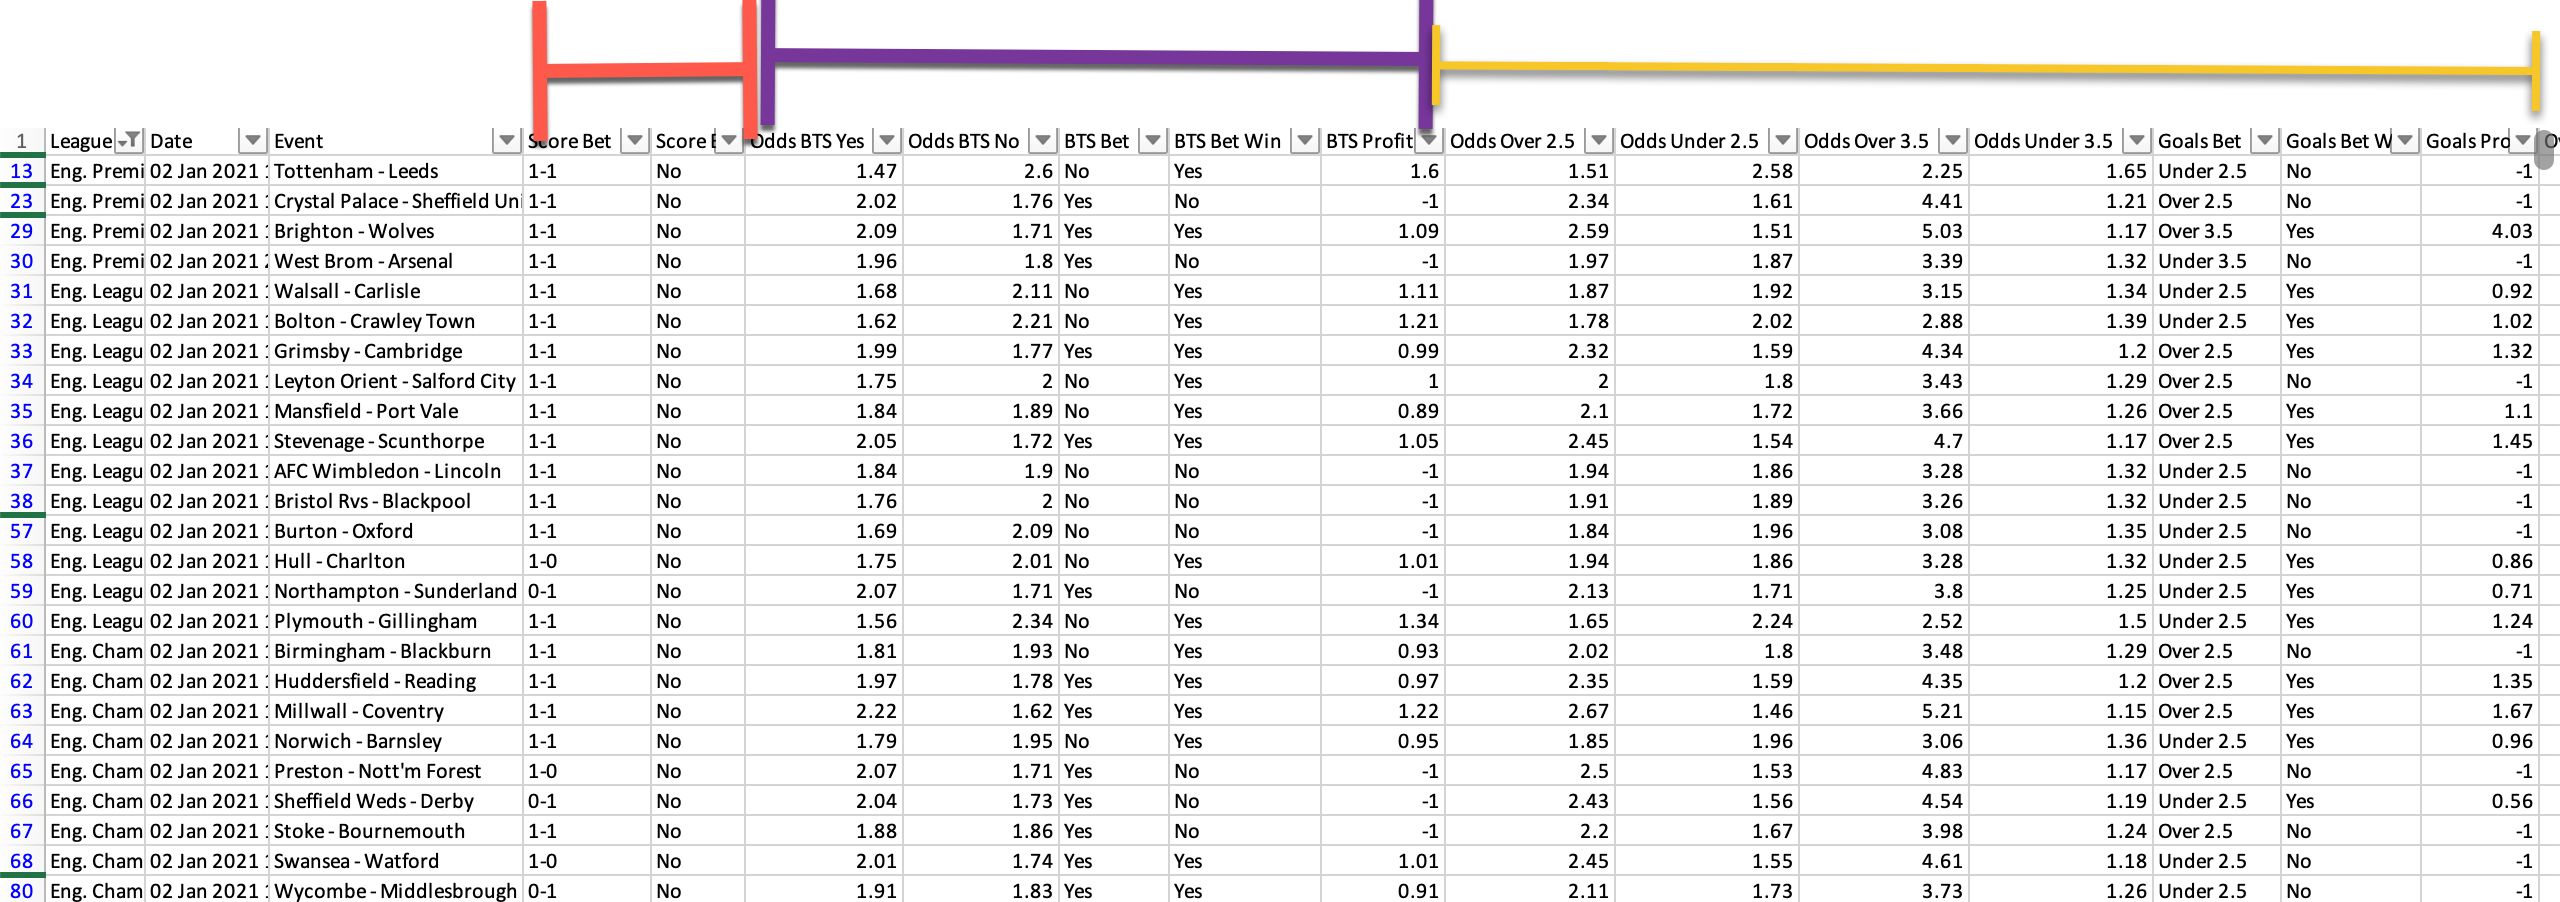
Th next section focuses mainly on the AI algorithm and its views across the main goal markets.
Red – what score does it expect the game to end as
Purple– whether both teams will score or not and the profitability of each recommendation. In this particular example, we would have done very well following these recommendations
Yellow – same as the Purple section, but focusing on Over and Under 2.5 / 3.5 goals.
All pretty straightforward but when this is combined with the next section we are going to show you, it can get very powerful indeed.
– Goal Probabilities & Value
As we saw in the first section (Match Odds and Probabilities), we are now able to apply the same opportunities to the goal markets. We can quickly see the database predictions around each of the goal markets and quickly identify whether we are getting value against the live odds.
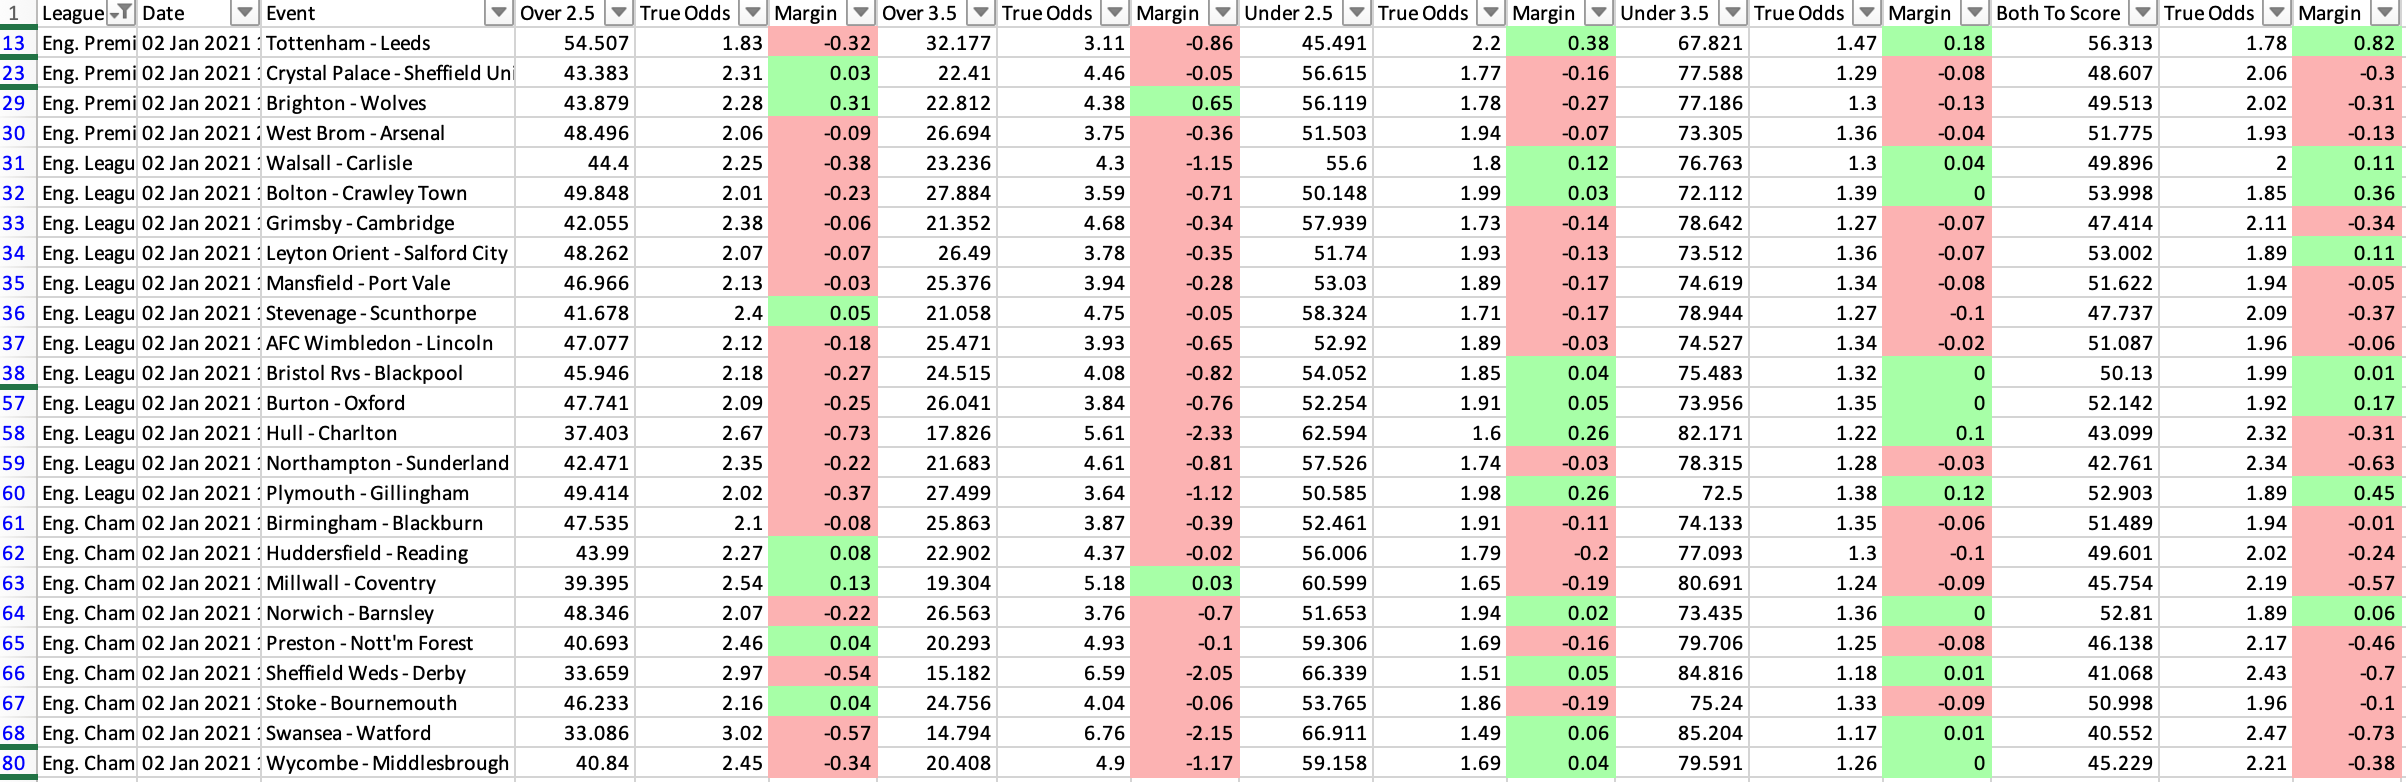
Let’s look at a quick example of how powerful these insights can be. Take the Brighton vs Wolves match from the weekend just gone.
The AI has predicted over 3.5 goals would be scored at huge odds of 4/1.

We can see we are getting a positive margin on both the Over 2.5 goals and Over 3.5 goals market. Meaning the odds available with the bookmakers are higher than they should be – instant value.
It is widely against the general market perception for this game but all our insight lines are going against the market, which is where we like to be, and this would have been a excellent betting or trading opportunity. And it would have taken us only a few seconds to spot this in the report.
– First Half Goal Insights
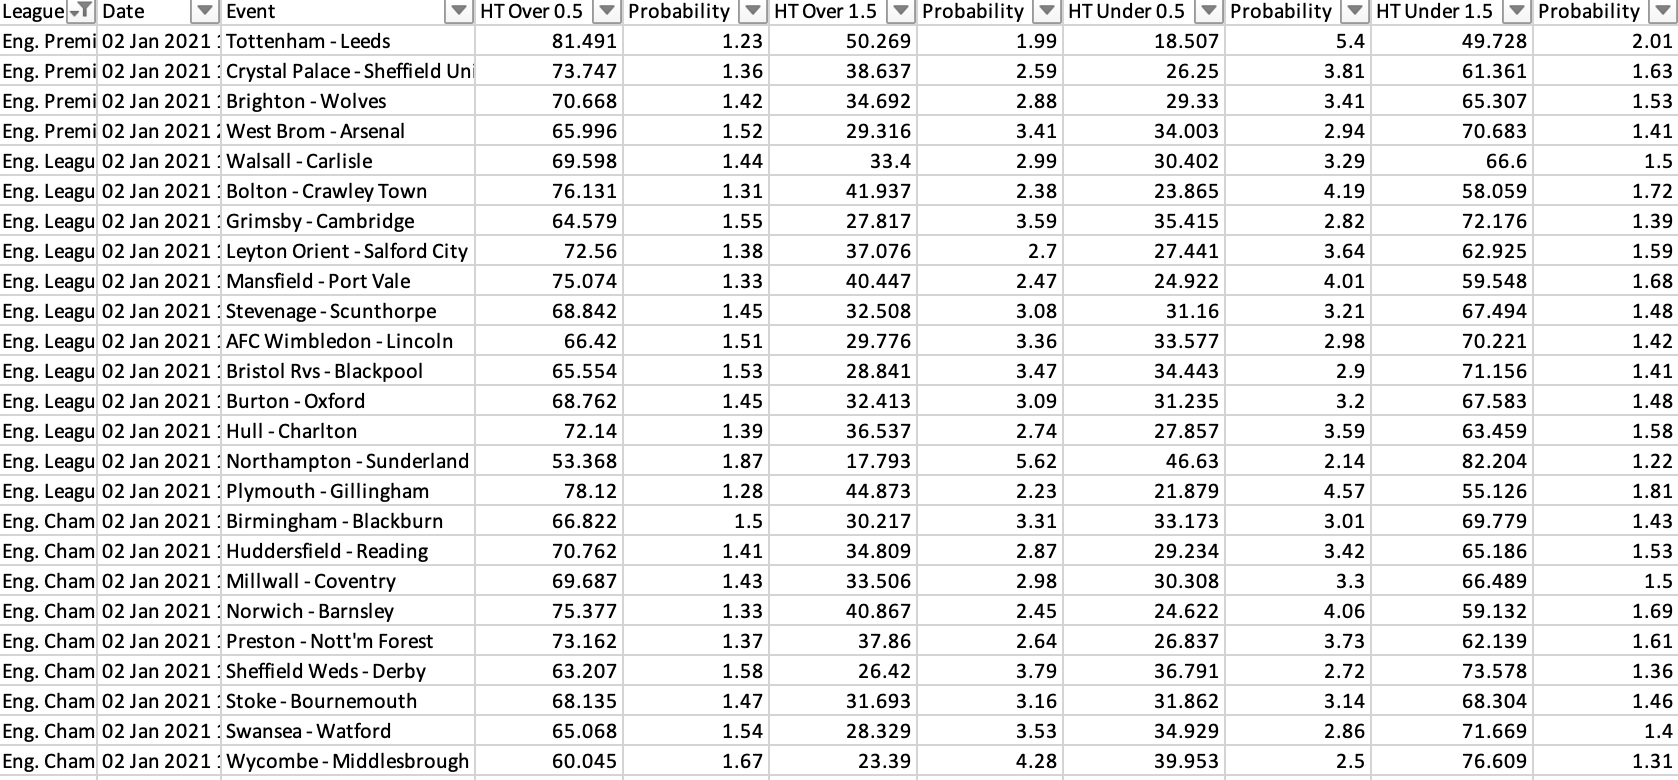
For football traders and first half bettors, this section of the report can be invaluable.
A couple of quick examples on how you may wish to cnosider using this data.
- You can easily see the probabilities and the equivalent odds conversions. Then jump
Crystal Palace vs Sheffield United had a 73.47 chance of a first half goal, which gives equivalent odds of around 1.33.
However, with the bookmakers were paying 1.50-1.55 – this is 65% improement on the true odds – excellent value!
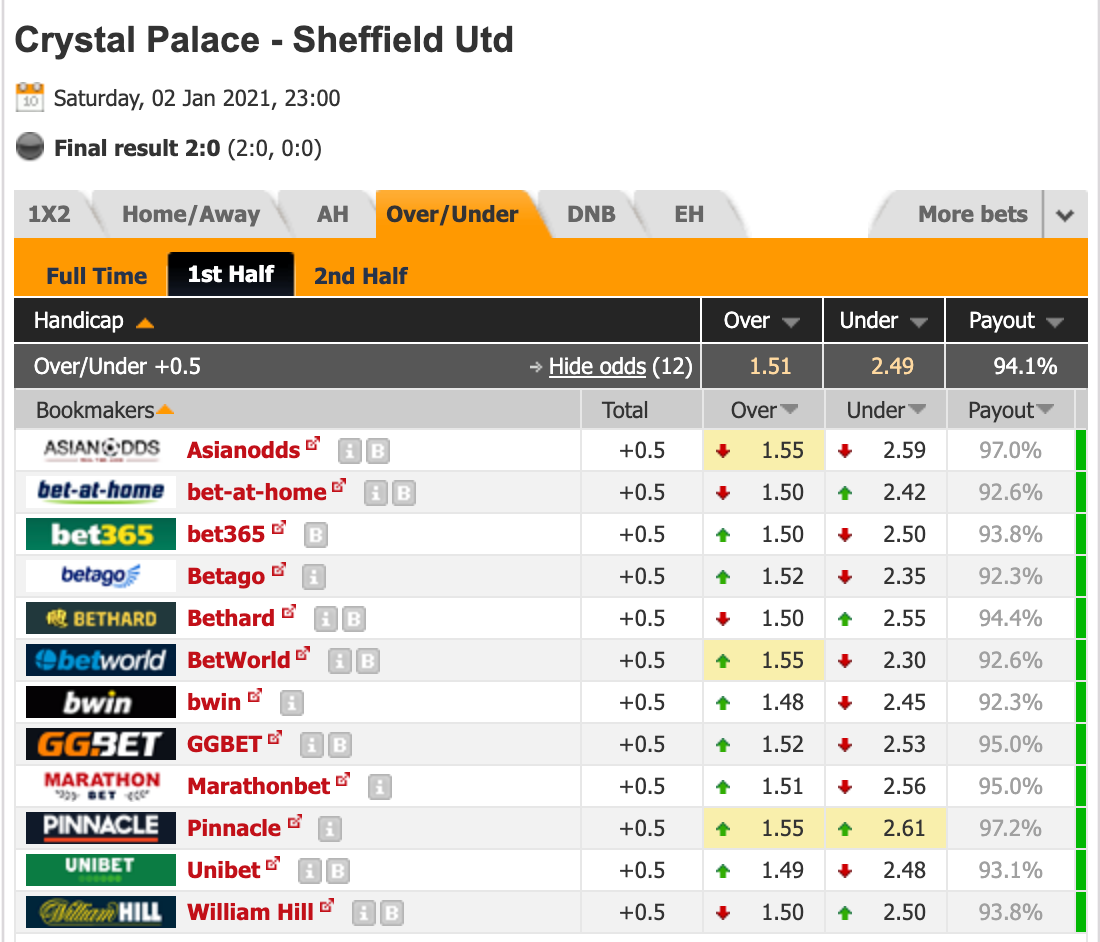
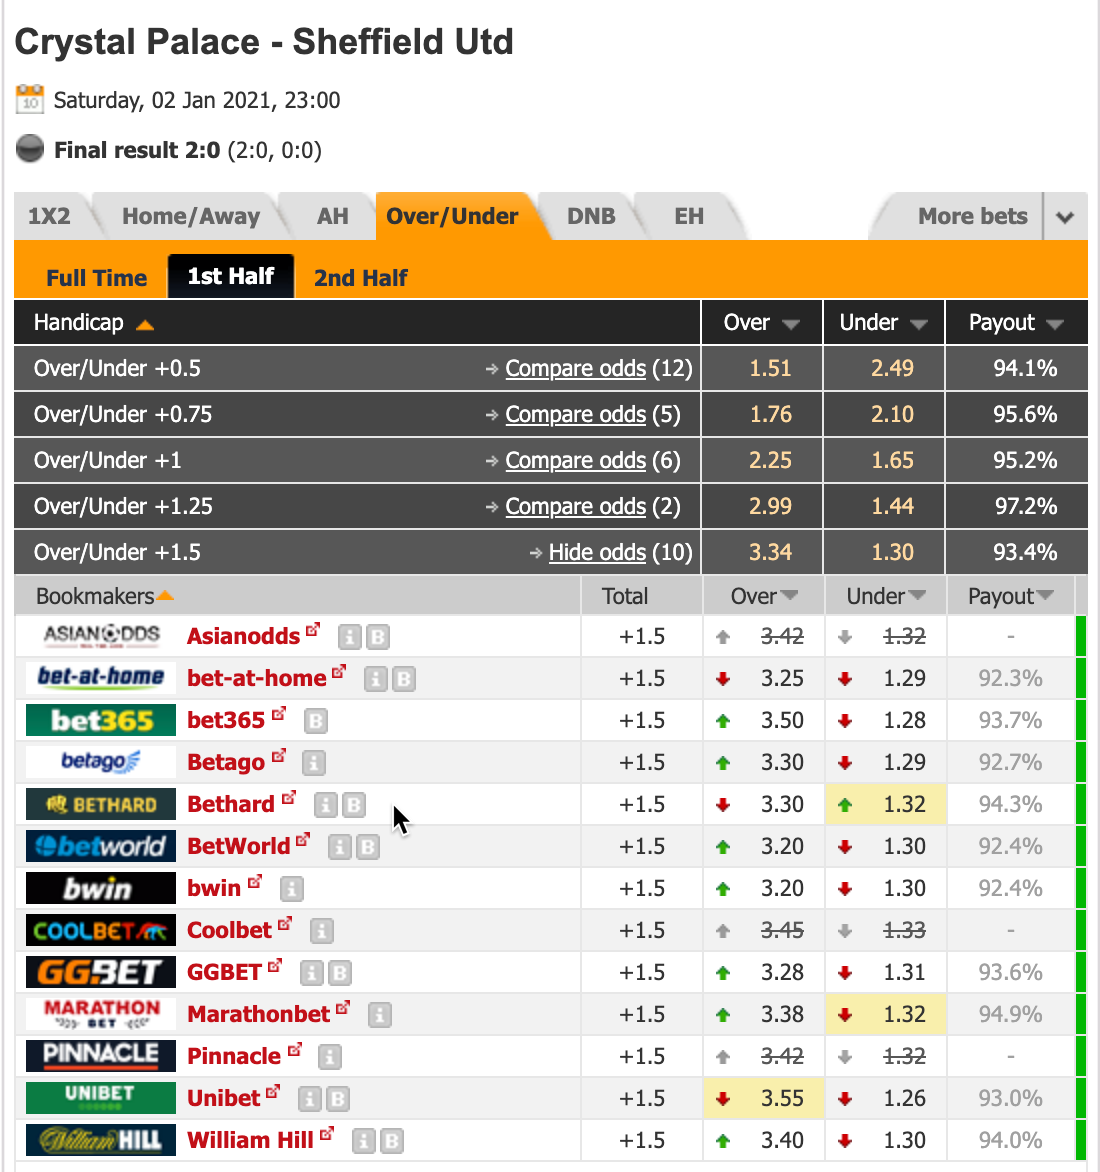
You could even have gone for Over 1.5 First Half goals. which was paying up to a huge 5/2 (3.50) when the true odds were a little over 6/4 (2.59)
2. The second method is to focus on high probability matches. In particular, I like this method when I’m looking to trade the first half markets with drip fed stakes
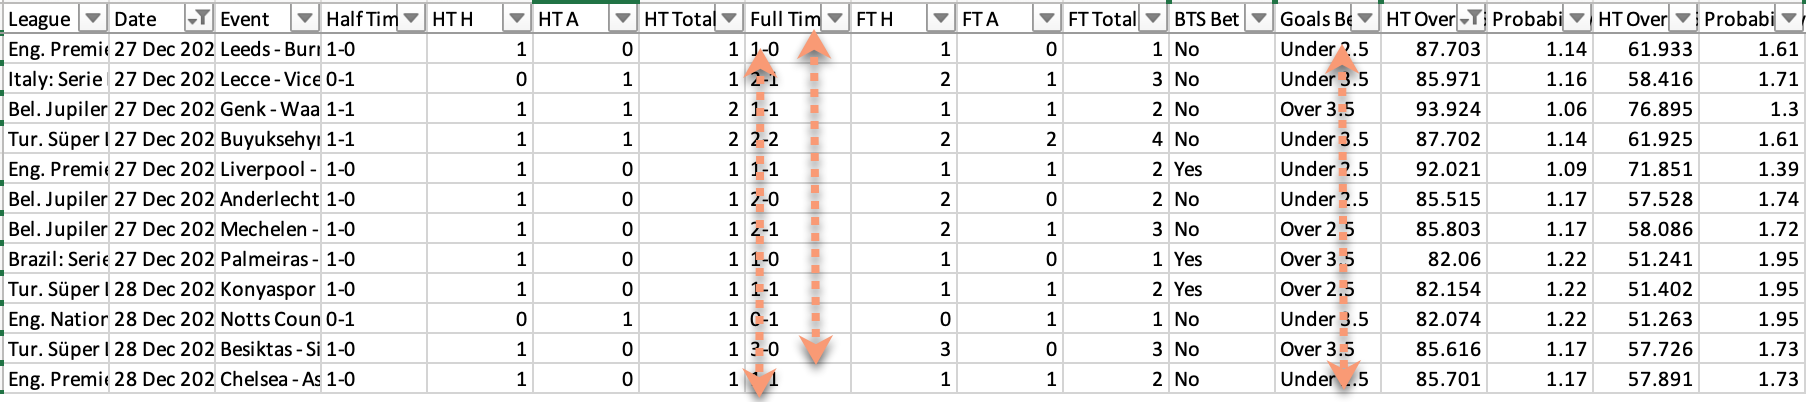
I look for any game with a 80%+ probability for a first half goal. I’ll then either looking at doing a few small accas or drip feeding the market during the first half.
For example, this approach across the 27th and 28th December would have yielded 12 winners from 12 matches. Whether trading or betting, you would have made a tidy profit.
– Goal Expectancy
Goal Expectancy is a good way to good way to quickly understand the perceived strengths of two sides. In simple terms it works by taking the home sides goals scored, minus their goals conceded. We do the same for the away team and then minus away team total from the home team.
Taking the Premier League games from the Saturday just gone, we’d have the following shortlisted and recommended.

- Tottenham recommended: result = WIN
- Crystal Palace recommended: result = WIN
- Brighton recommended: result = DRAW
- Arsenal recommended: result = WIN
Three wins from four and a draw in the other. Whether betting or trading these are great (and quick) indicators on how a match may shape up.
– Correct Scores
The final section of the report covers correct scores and can again provide invaluable insights for both bettors and traders.

Taking the La Liga games from Saturday.
Real Madrid – Celta
2-0 was the clearly the most likely score (with 2-1 a possibility). The final result? 2-0 to Real Madrid.
Getafe – Valladolid
A low scoring game expected and a dutch of 1-0, 0-1, and 1-1 is the indicated approach for this one. Final result? 0-1 to Valladolid
Betis – Sevilla
The Andalusian derby. The AI is indicating Sevilla to edge it 0-1 or the game to finish 1-1. Final result? 1-1
Villarreal – Levante
1-0, 1-1 have the highest probability but with Villarreal strongly fancied for this game, the 2-0 and 2-1 score lines also have a high probability. Final result? 2-1 Villarreal
Getting a feel for the likely number of goals and scoreline can be a really useful insight to include in your insight. Not just for betting or trading the correct scores, but, it can be used to inform other decisions such as back a Real Madrid win or the draw in the Andalusian derby.
In Summary
The new daily report from our AI analysis is hugely valuable proposition for your betting and trading. It is literally one of the first things that I check and I use it daily to form a large part of my betting and trading day ahead.
When using this report correctly, you can always ensure that you have the probabilities, odds and value in your favour before entering any trade or bet.
There are almost limitless ways that you can use this report and we are sure that you’ll find many more ways than what we have shown you here.
But perhaps the best bit? It’s completely free and available to all Predictology members.
I did see someone trying to sell a spreadsheet for £500 over the Christmas break, did you? Well, as usual, Predictology beats the market and offers our members the best value in everything we do!
Not a member yet? You can get started


I bought that spreadsheet. Albeit for £157.00 for the rest of the season.
I find it very clunky to use and to get anything from it you have to manually enter the league, teams per match and home/away odds. It covers 10 leagues (another 17 will cost an extra £97.00 for this season).
On a Saturday or Sunday it takes an age to enter all the info just to get started on finding value. After an hour of typing I’m glad I only have 10 leagues, I couldn’t face doing this for 27 of them!.
One thing I will say in its favour though is that it’s perceived value is based against betfair true odds, which are a lot more efficient than bookie odds as there is no 3-4% bookie round to pay.
I was on first reading through this impressed. After realising that your value base ( bookie true odds, not betfair true odds) is flawed, I’m not so convinced as to the how true the value is that your model shows.
Hi Ricky,
Firstly, our post is not take disparage anyone else’s services or products but more to highlight that we feel at least, that there are better and more cost effective solutions in the market such as our AI reports.
As for your comment about price. Please note the prices are aggregated across 20+ bookmakers including Betfair. So do not agree that the data is inefficient or flawed in any way.
Does this spreadsheet require you to have programs such as Microsoft office
Hi Mike
It is an excel file yes. It’s generally the easiest and most accessible format for people to use.