May 17, 2026
Bet Builders vs. Single Bets: The Truth About Correlation Pricing and Hidden +EV
If you have spent any time on a sportsbook app lately, you have probably been bombarded with “Bet Builders” or...
In-play Timing; for most football bettors, the in-play market is a chaotic environment where decisions are often driven by gut feeling or the “eye test.” You’ve been there: a team looks dominant, they’ve had three corners in a row, and you feel a goal is coming. You place the bet, and then… nothing. The momentum […]
In-play Timing; for most football bettors, the in-play market is a chaotic environment where decisions are often driven by gut feeling or the “eye test.” You’ve been there: a team looks dominant, they’ve had three corners in a row, and you feel a goal is coming. You place the bet, and then… nothing. The momentum fizzles out, and the match settles back into a mid-block stalemate.
The problem isn’t your intuition; it’s your in-play timing.
In the world of professional sports analytics, we don’t rely on “feel.” We rely on momentum quantification. While most amateur punters look at total match stats (like possession or total shots), professional traders are looking at rolling data windows.
Today, we’re diving into a simple but powerful trick: using 5-minute rolling pressure data to identify the exact moment a goal becomes statistically probable, allowing you to enter the market at the peak of value before the odds catch up.
Standard match statistics are “cumulative.” If a team had 15 shots in the first half but hasn’t left their own half for the first 15 minutes of the second half, their cumulative stats still look impressive. A casual bettor looking at a standard live score app will see “15 shots” and think the team is still dominant.
The data is lying because it’s stale.
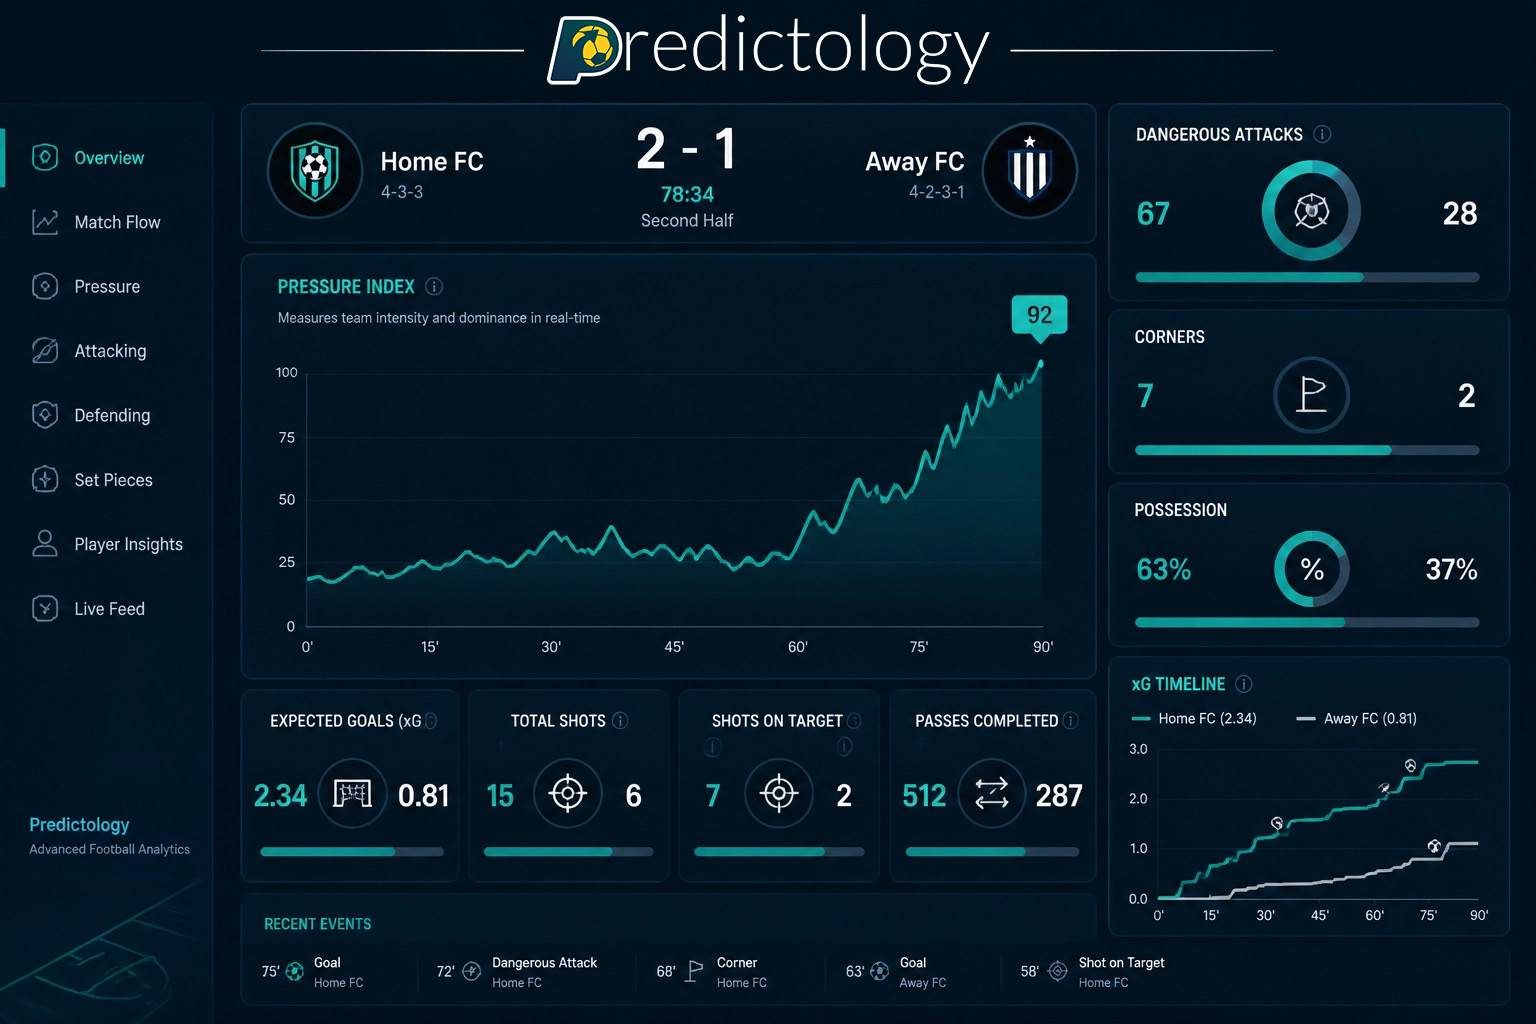
In-play betting is a game of present conditions, not historical performance. To win consistently, you need to know what is happening right now. This is where the Pressure Index comes in. It doesn’t care what happened in the 10th minute; it only cares about the sustained attacking intensity occurring in the current phase of play.
By focusing on narrow windows: specifically 5-minute rolling bursts: you can filter out the “noise” of the match and isolate the “signal” of a goal-scoring opportunity.
At Predictology, we define the Pressure Index as an aggregated metric that combines several key indicators:
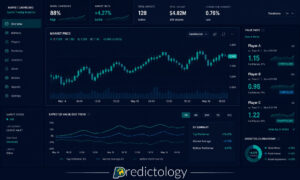
While many platforms offer a 10-minute or 15-minute pressure graph, the 5-minute rolling window is the “sweet spot” for in-play timing.

As shown in the graphic above, 10-minute data is excellent for identifying general dominance. It tells you which team is “better” on the day. However, 5-minute data is reactive. It captures the explosive spikes: the moment a team shifts through the gears or a defender begins to tire.
In a 5-minute window, every corner and every shot carries significant weight. When the index spikes in this short timeframe, it indicates an acute failure in the opposition’s defensive structure. If you wait for the 10-minute index to catch up, the goal has often already been scored, or the odds have crashed so low that the Expected Value (+EV) has vanished.
So, how do you turn this data into a bankroll-building strategy? We call it Peak Hunting.
The goal is to identify a team that is significantly over-performing its 5-minute pressure average compared to the match average. Here is the step-by-step framework:
Don’t just look for spikes in any game. Look for games where there is a Motivation Mismatch.
Monitor your live data dashboard for a “Pressure Spike.” You are looking for a team to hit a Pressure Index rating of 80 or higher within a 5-minute rolling window. This usually indicates 2+ dangerous attacks and at least one set-piece or shot in a very short span.
When the spike occurs, you have a narrow window of 2–3 minutes to place your bet before the market adjusts or the goal occurs.

While the 5-minute pressure index tells you about intensity, it doesn’t always tell you about quality. This is why professional analysts combine pressure data with Live xG (Expected Goals).
In our recent breakdown of Pressure Index vs Live xG, we discussed how these two metrics work in tandem. Pressure is the “engine” of the attack, while xG is the “efficiency” of the finish.
The “Golden Signal” occurs when:
This suggests that the team is creating high-quality chances and it is only a matter of time (and probability) before the ball hits the back of the net. This is where you find the most significant edge over the bookmaker’s algorithms, which often lag behind these nuanced momentum shifts.
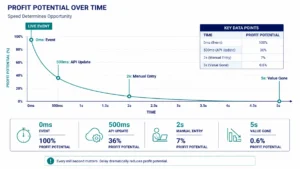
To move from a casual bettor to a professional trader, you must balance your data usage with strict operational discipline.

At Predictology, we’ve built the tools specifically to help you execute this “5-minute trick” without having to stare at a screen for 12 hours a day.
The “simple trick” isn’t magic; it’s granularity. By narrowing your focus from the full 90 minutes to 5-minute rolling windows, you stop betting on what has happened and start betting on what is about to happen.
Next time you’re looking at an in-play market, ignore the total shot count. Look for the burst. Look for the team that is pinning their opponent into a corner right now. When you see that 5-minute spike, you’ve found your entry.
Ready to level up your in-play game? Join our community of data-driven bettors and get access to the Predictology System Builder to start testing your own pressure-based models today.
May 17, 2026
If you have spent any time on a sportsbook app lately, you have probably been bombarded with “Bet Builders” or...
May 17, 2026
Overfitting; the dream of every data-driven bettor is a “perfect” system. We open a tool like the Predictology Strategy Builder,...
May 17, 2026
Latency; in the world of high-stakes football betting, being “right” is only half the battle. You can have the most...
May 17, 2026
Easy Edges; in the sports betting world of 2026, the term “easy money” feels like a relic of a distant...
May 17, 2026
Bet Delay; for many football bettors, the transition from manual betting to full automation feels like the ultimate “level up.”...
May 17, 2026
If you have spent any time on a sportsbook app lately, you have probably been bombarded with “Bet Builders” or...
May 17, 2026
Overfitting; the dream of every data-driven bettor is a “perfect” system. We open a tool like the Predictology Strategy Builder,...
May 17, 2026
Latency; in the world of high-stakes football betting, being “right” is only half the battle. You can have the most...
May 17, 2026
Easy Edges; in the sports betting world of 2026, the term “easy money” feels like a relic of a distant...
May 17, 2026
Bet Delay; for many football bettors, the transition from manual betting to full automation feels like the ultimate “level up.”...
Join the Discussion
We respect your privacy — your email won’t be shown. Fields marked * are required.