July 26, 2026
Beyond the Full-Time Result: Profiting from 1st Half Goals and xG Trends
Expected Goals (xG); many recreational bettors spend their Saturday afternoons fixated on the final whistle. They track full-time results, late...
Pressure Index; in the fast-moving world of live football betting, timing is everything, but the data you use to drive those decisions is what separates the consistent winners from the casual punters.

For years, in-play bettors relied on basic “momentum” stats: shots, corners, and possession: to gauge which team was most likely to score next. However, as the industry has matured, two heavyweights have emerged in the analytical space: Pressure Index (PI) and Live Expected Goals (Live xG).
While both aim to tell you who is dominating the pitch, they do so through very different lenses. One tracks the volume of activity; the other quantifies the quality of the threat. Understanding the nuances between these two is crucial if you want to find high-value betting opportunities before the market adjusts.
Before we dive into which is superior, we need to define exactly what these metrics are measuring. At Predictology, we emphasize data-driven decision-making, and that starts with knowing your tools.
Pressure Index is a cumulative metric designed to show momentum. It typically combines variables like dangerous attacks, total shots, and corners into a single score. If a team has a high PI, they are spending a lot of time in the final third and throwing the “kitchen sink” at their opponents. It is essentially a visual representation of which team is “on top” of the match at any given moment.
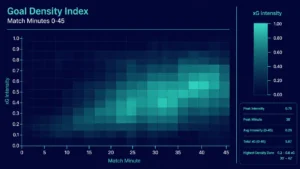
Live xG (Expected Goals) is a more refined statistical model. Instead of counting how many shots a team takes, it assigns a probability value: ranging from 0.00 to 1.00: to every single shot based on historical data. Factors like shot distance, angle, and type of assist are all factored in. A team might have a lower Pressure Index than their opponent, but if they are creating high-probability chances through clinical counter-attacks, their Live xG will be significantly higher.

The most common trap in-play bettors fall into is the “Momentum Fallacy.” We’ve all seen it: a home favorite is down 1-0, they have 12 corners and 15 shots in the second half, and their Pressure Index is off the charts. The casual bettor sees this “pressure” and assumes a goal is inevitable.
However, if those 15 shots were all from 25 yards out and contested by three defenders, the Live xG might only total 0.45. Conversely, the away team might have only had one shot in that same period, but it was a clear 1-on-1 with the keeper (worth 0.65 xG).
In this scenario, Pressure Index signals dominance, but Live xG signals danger. The betting market: and specifically the automated odds models used by bookmakers: often overreacts to Pressure Index (volume), causing the odds on the “dominating” team to shorten too much. This creates +EV opportunities on the counter-attacking side or in the “Under” markets, as the actual probability of a goal is lower than the activity suggests.
While Live xG is scientifically more robust, the Pressure Index still has its place in a professional’s toolkit. It is particularly effective for certain niche markets:
The most profitable moments occur when Pressure Index and Live xG diverge. If PI is high but xG is flat, the “pressure” is toothless. If PI is low but xG is spiking, you have found a clinical team that the market is likely underestimating.

For most data-driven bettors, Live xG is the superior metric for one simple reason: it is predictive, not just descriptive.
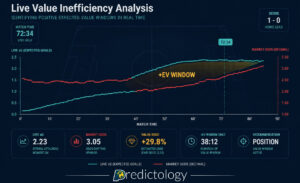
When you use the Predictology Live Value Bet Finder, you aren’t just looking for who is attacking. You are looking for instances where the Live xG probability suggests a goal should have occurred (or is highly likely to), but the scoreline hasn’t changed yet.
Bookmakers are incredibly fast, but they aren’t perfect. Often, there is a 30 to 90-second window where the live odds haven’t fully accounted for a massive increase in xG. By monitoring real-time xG, you can lock in a price before the market “corrects” itself after a series of high-quality chances.
Counter-attacking teams are the bane of the casual bettor’s existence, but they are a goldmine for those using advanced football betting analytics. A team playing “low block” football will have a terrible Pressure Index, but they might be creating the highest-quality chances of the match. Live xG identifies this efficiency, allowing you to back the underdog at inflated odds.
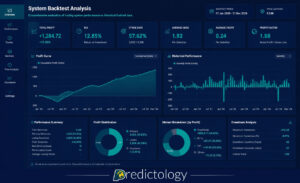
Knowing the theory is one thing; executing it in real-time is another. This is where Predictology’s suite of tools comes into play. We’ve built our platform to do the heavy lifting for you, filtering through 400k+ matches and thousands of data points to highlight where the value truly lies.
You don’t need to stare at a screen all day. Our In-Play Alerts can be configured to notify you the moment a specific set of data criteria is met. For example, you can set an alert for matches where:
This allows you to move from “guessing” based on what you see on TV to executing a professional betting strategy based on proven statistical triggers.

The ultimate goal for many of our members is full automation. By integrating Predictology data with tools like BF Bot Manager, you can remove the emotional element of betting entirely.
Instead of debating whether a team “looks” like they are going to score, your bot simply looks at the delta between Live xG and the market price. If the numbers align, the bet is placed instantly. This is how professional bettors scale their operations: moving from manual analysis to systematic, data-driven execution.
If you’re new to these concepts, our LaunchPad educational resources provide a step-by-step guide on how to build your first systematic betting model. We don’t just give you the data; we teach you how to think like an analyst.

If you had to choose just one, Live xG is the clear winner for spotting long-term value. It provides a level of context that volume-based stats like the Pressure Index simply cannot match. It cuts through the “noise” of aimless possession and tells you exactly how close a team is to actually putting the ball in the net.
However, the elite bettor uses both. Use Pressure Index to understand the “story” of the match and how the market is likely to react, then use Live xG to verify if that story is backed by facts.
Practical Takeaway:
Next time you’re watching a live match, don’t be swayed by a high corner count or constant attacks. Check the Live xG. If the pressure is high but the xG is low, look for opportunities to go against the grain. If both are high, you’ve likely found a genuine “goal-a-waiting” scenario.
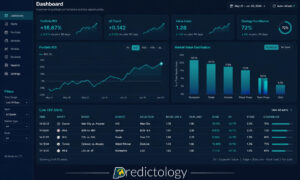
Ready to stop guessing and start using professional-grade data? Explore the Predictology System Builder today and start building your own data-driven betting portfolio.
July 26, 2026
Expected Goals (xG); many recreational bettors spend their Saturday afternoons fixated on the final whistle. They track full-time results, late...
July 26, 2026
In the world of football betting, 2026 marks a significant turning point. Just a few years ago, Expected Goals (xG)...
July 26, 2026
Expected Value (+EV) For the majority of football bettors, the live market is a whirlwind of emotion, reaction, and guesswork....
July 26, 2026
System Builder; for most football bettors, the journey starts with a gut feeling. You see a home team with a...
July 26, 2026
Analytics; to move from a casual punter to a professional bettor, you must transition from making “picks” to executing a...
July 26, 2026
Expected Goals (xG); many recreational bettors spend their Saturday afternoons fixated on the final whistle. They track full-time results, late...
July 26, 2026
In the world of football betting, 2026 marks a significant turning point. Just a few years ago, Expected Goals (xG)...
July 26, 2026
Expected Value (+EV) For the majority of football bettors, the live market is a whirlwind of emotion, reaction, and guesswork....
July 26, 2026
System Builder; for most football bettors, the journey starts with a gut feeling. You see a home team with a...
July 26, 2026
Analytics; to move from a casual punter to a professional bettor, you must transition from making “picks” to executing a...

Join the Discussion
We respect your privacy — your email won’t be shown. Fields marked * are required.