July 26, 2026
Beyond the Full-Time Result: Profiting from 1st Half Goals and xG Trends
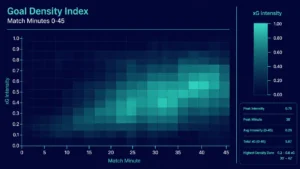
Expected Goals (xG); many recreational bettors spend their Saturday afternoons fixated on the final whistle. They track full-time results, late...
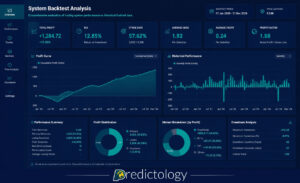
Backtesting; you have spent weeks scouring the data. You have tested dozens of variables, refined your league selections, and finally, the Predictology System Builder delivers the result you have been hunting for: a strategy with a consistent 12% Return on Investment (ROI) over the last five seasons. On paper, you have found a goldmine. You prepare your bankroll, set up your automation, and wait for the profits to roll in.
But three months into live trading, something is wrong. Your actual ROI isn’t 12%; it is barely 2%, and after a small losing streak, you are actually in the red. You double-check your logic, but the filters are correct. The teams are performing as expected. So, where did the money go? The answer lies in two critical factors that many bettors ignore during the backtesting phase: commission and slippage. Without accounting for these “transaction costs,” your backtesting results are not a forecast: they are an illusion.

In the world of professional betting analytics, there is a massive gulf between theoretical profit and realised profit. Most historical databases, including the raw data used for backtesting, record the “Closing Odds” or “Starting Price” (SP). While these are essential benchmarks for measuring whether you are beating the market, they represent a “clean” environment that doesn’t exist in the real world.
When you run a model through a system builder, the software calculates your profit by simply subtracting your stake from the winnings based on the recorded odds. This is your Gross Profit. It assumes that you can always get the exact price listed in the database and that you get to keep every penny of your winnings.
In reality, betting is a business, and every business has overhead. If you were running a retail store, you wouldn’t calculate your success based on total sales; you would calculate it based on sales minus the cost of goods, rent, and taxes. In football betting, commission and slippage are your rent and taxes. If your backtesting doesn’t account for them, you are effectively ignoring the costs of running your operation.
If you are betting on a traditional sportsbook, the “commission” is already baked into the odds (known as the overround or the vig). However, professional bettors and traders frequently use betting exchanges like Betfair to access better prices and higher liquidity. The catch? You have to pay a commission on your net winnings.
On Betfair, commissions typically range from 2% to 5% depending on your location and rewards tier. While 5% might sound small, its impact on your Net ROI is catastrophic if you have a high-turnover, low-margin strategy.
Let’s look at a typical scenario:
Gross Calculation:
Net Calculation (with 5% Commission):
In this example, the commission didn’t just take 5% of your profit; it wiped out 44% of your total ROI. If your backtesting showed a 4% ROI and you didn’t account for commission, you would actually be operating at near-break-even or even a loss in the live market.

While commission is a predictable cost, slippage is more erratic and often harder to quantify. Slippage is the difference between the price you expect to get (the price in your backtest) and the price you actually get when your bet is matched.
There are three primary reasons for slippage in football betting:
In betting, a “tick” is the smallest increment a price can move. For example, moving from 2.00 to 1.99. It seems negligible, but over a sample of 1,000 bets, losing just one or two ticks of value on every bet can be the difference between a professional-grade strategy and a failing one. This is why we emphasize long-term thinking at Predictology; small efficiencies compound into massive gains: or massive losses.

To improve the accuracy of your backtesting, you need to “stress test” your results. Here is a professional workflow for adjusting your expectations before putting real money on the line:
Don’t wait until the end of the month to see how commission affects you. When analyzing your results in the Predictology System Builder, manually adjust your winning odds. If your average winning price is 2.00 and you pay 5% commission, treat your average winning price as 1.95 for all your calculations. If the system still looks profitable at the lower price, you have a robust model.
A common practice among professional traders is to assume they will get one or two ticks worse than the recorded closing price. If the database says 1.80, run your math as if you got 1.78. This creates a “margin of safety.” If a system requires you to get the absolute peak price every single time to stay profitable, it is likely too fragile for live execution.
Use Predictology’s analytics to see if your strategy’s ROI is dependent on a very narrow range of odds. If your system only works at exactly 2.10 but loses money at 2.06, it is highly susceptible to slippage. Look for strategies that show a “profit plateau”: where the ROI remains stable even if the odds fluctuate slightly.
The goal of using tools like the System Builder or our +EV Strategy Builder isn’t just to find high numbers; it is to find sustainable value.
When you are browsing our database of 400,000+ matches, remember that the most successful members of the Predictology community are those who prioritize process over results. They understand that a 5% ROI that has been adjusted for commission and slippage is infinitely more valuable than a “raw” 15% ROI that will vanish the moment it hits the live exchange.

Next time you build a system, follow this Validation Checklist:
By accounting for these factors, you move away from the “get rich quick” mentality of casual punters and toward the data-driven professional approach that Predictology was built to support. The math might be slightly more sobering, but your bankroll will thank you in the long run.
Ready to build a strategy that stands up to real-world conditions? Log in to the Predictology System Builder today and start stress-testing your models.
July 26, 2026
Expected Goals (xG); many recreational bettors spend their Saturday afternoons fixated on the final whistle. They track full-time results, late...
July 26, 2026
In the world of football betting, 2026 marks a significant turning point. Just a few years ago, Expected Goals (xG)...
July 26, 2026
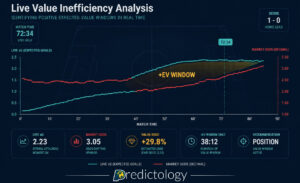
Expected Value (+EV) For the majority of football bettors, the live market is a whirlwind of emotion, reaction, and guesswork....
July 26, 2026
System Builder; for most football bettors, the journey starts with a gut feeling. You see a home team with a...
July 26, 2026
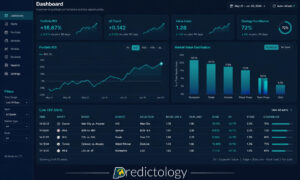
Analytics; to move from a casual punter to a professional bettor, you must transition from making “picks” to executing a...
July 26, 2026
Expected Goals (xG); many recreational bettors spend their Saturday afternoons fixated on the final whistle. They track full-time results, late...
July 26, 2026
In the world of football betting, 2026 marks a significant turning point. Just a few years ago, Expected Goals (xG)...
July 26, 2026
Expected Value (+EV) For the majority of football bettors, the live market is a whirlwind of emotion, reaction, and guesswork....
July 26, 2026
System Builder; for most football bettors, the journey starts with a gut feeling. You see a home team with a...
July 26, 2026
Analytics; to move from a casual punter to a professional bettor, you must transition from making “picks” to executing a...

Join the Discussion
We respect your privacy — your email won’t be shown. Fields marked * are required.