
May 17, 2026
Bet Builders vs. Single Bets: The Truth About Correlation Pricing and Hidden +EV
If you have spent any time on a sportsbook app lately, you have probably been bombarded with “Bet Builders” or...
Overfitting; the dream of every data-driven bettor is a “perfect” system. We open a tool like the Predictology Strategy Builder, layer on some filters, and watch the profit graph climb at a 45-degree angle. It looks flawless. The ROI is 25%, the drawdown is minimal, and the win rate is sky-high. You feel like you’ve […]
Overfitting; the dream of every data-driven bettor is a “perfect” system. We open a tool like the Predictology Strategy Builder, layer on some filters, and watch the profit graph climb at a 45-degree angle. It looks flawless. The ROI is 25%, the drawdown is minimal, and the win rate is sky-high. You feel like you’ve cracked the code.
Then, you go live.
Within three weeks, that smooth profit line turns into a jagged descent. The “edge” you discovered vanishes. You didn’t find a gold mine; you found a ghost. This phenomenon is known as overfitting (or curve-fitting), and it is the single biggest reason why most betting models fail when they move from the backtester to the real market.
Overfitting happens when a model “memorizes” the noise and random fluctuations of historical data rather than learning the underlying signals that predict future outcomes. In this guide, we’ll break down the 7 most common mistakes bettors make when building models and, more importantly, how to fix them using professional-grade validation techniques.
The most common way to overfit a model is to apply too many filters. In the Predictology Strategy Builder, it’s tempting to keep adding criteria until the backtest looks perfect.
If you add a filter like “Home team must have won 3 of their last 5” and then add “Away team must have conceded in the first half” and then add “Temperature must be below 15 degrees,” you aren’t building a strategy; you are describing a very specific set of historical matches that happened to end in a certain way.
The Fix: The Rule of Three.
As a general rule, try to limit your core strategy to 3-5 meaningful filters. Every time you add a filter, you should ask: “Is there a logical, football-based reason why this filter creates an edge?” If the answer is “It just makes the graph look better,” delete it. High-performing, robust models are almost always simple.
A strategy that shows 30% ROI over 40 matches is statistically meaningless. In sports betting, variance is massive. Small sample sizes are prone to “clustering,” where a run of good luck looks like a sustainable edge.
Research into sports betting models suggests that you need a minimum of 139 observations to even begin discussing statistical significance, and even then, the margin of error remains high.

The Fix: Set a High Minimum Bet Count.
When backtesting in Predictology, never trust a system with fewer than 300-500 bets across multiple seasons. The larger the sample, the more likely the results reflect a genuine edge rather than a sequence of random noise. Use the Portfolio Tracker to monitor how your sample size grows and whether your ROI is converging toward a stable number.
Optimization is the process of “tweaking” variables to get the best result. For example, you might test whether a system works better at odds of 1.80 vs 1.90. If you find that 1.87 is the “sweet spot” for profit, you might be tempted to set your filter exactly there.
The problem? That 1.87 figure is specific to the past. In the future, the sweet spot might be 1.82 or 1.95. By optimizing too tightly, you create a model that is brittle.
The Fix: Use “Ranges” Rather Than “Points.”
Instead of picking the absolute peak of a profit curve, look for “Profit Plateaus.” If a strategy is profitable at odds of 1.70, 1.80, and 1.90, it is robust. If it only makes money at exactly 1.87, it’s a fluke. Build your strategies around broad, stable ranges that can withstand minor market shifts.
If you use all your available data to build your strategy, you have nothing left to test it against. Professionals divide their data into two sets: In-Sample (used to build the model) and Out-of-Sample (used to verify it).
If a model performs brilliantly on your training data (2020-2023) but fails on your testing data (2024), it is overfitted.

The Fix: The 70/30 Split.
Use 70% of your historical data to develop your strategy. Once you are happy with the results, run the strategy against the remaining 30% (the most recent data) without changing a single filter. If the ROI remains positive, you likely have a robust model. If the ROI tanks, the model was curve-fitted to the first 70%.
Your backtest might say you can get odds of 2.10, but if the market “closes” at 1.95, your model is essentially useless. The Closing Line Value (CLV) is the most accurate representation of the “true” probability of an event. If your strategy doesn’t consistently beat the closing price, it won’t be profitable in the long run.
The Fix: Incorporate CLV Analysis.
When using Predictology’s Live Value Bet Finder, compare the odds you are taking to the eventual closing price. A robust model should beat the closing line at least 55-60% of the time. If your backtest shows profit but your “Beat the Closing Line” metric is negative, you are likely benefiting from random variance, not an edge.
When a bettor has spent hours building a model that almost works, they often fall into the trap of “fixing” it by adding one final filter to remove a specific losing streak. This is the definition of overfitting. You are literally telling the model: “Ignore these specific 10 losses that happened in October 2022.”

The Fix: Accept the Drawdowns.
Every profitable strategy has losing streaks. A robust model’s strength is not the absence of losses, but the ability to recover from them. Instead of filtering out losses, use Monte Carlo Simulations or basic variance analysis to understand if your drawdown is within expected limits. If the drawdown is mathematically normal for your win rate, don’t touch the filters.
Data leakage happens when information that wouldn’t be available at the time of the bet “leaks” into your model. For example, using “Final Season Standing” as a filter for a match played in Week 4 is data leakage. You wouldn’t know the final standing in Week 4, so the model is using “future” information to predict the “past.”
The Fix: Strict Chronological Backtesting.
Always ensure your filters are based on “Time of Bet” data. This is why we emphasize Walk-Forward Validation. By testing your model in chronological steps: training on Month 1, testing on Month 2, then training on Months 1-2, testing on Month 3: you ensure that no future data can contaminate your results.

Building a profitable betting model isn’t about finding the highest ROI in a backtest. It’s about building a system that survives the transition to live markets.
Your Practical Takeaway:
Next time you build a strategy in Predictology, try to break it. Remove your most “successful” filter and see if it’s still profitable. Test it on a league you didn’t include in the original build. If the model is robust, it will bend but not break. If it was overfitted, it will shatter.
To start building robust, data-driven strategies today, head over to the Predictology LaunchPad and learn how to use our advanced analytics tools to find genuine +EV opportunities.
Ready to move from “lucky” to “professional”?
Join Predictology today and get access to the System Builder, Live Value Finder, and our full suite of automation tools designed to help you scale your edges without the risk of overfitting.
May 17, 2026
If you have spent any time on a sportsbook app lately, you have probably been bombarded with “Bet Builders” or...
May 17, 2026
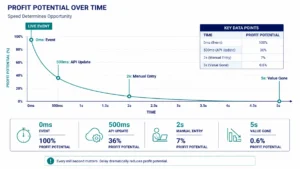
Latency; in the world of high-stakes football betting, being “right” is only half the battle. You can have the most...
May 17, 2026
Easy Edges; in the sports betting world of 2026, the term “easy money” feels like a relic of a distant...
May 17, 2026
Bet Delay; for many football bettors, the transition from manual betting to full automation feels like the ultimate “level up.”...
May 17, 2026
Pressure Index; in the fast-paced world of in-play football betting, relying on basic statistics like “Total Shots” or “Corners” is...
May 17, 2026
If you have spent any time on a sportsbook app lately, you have probably been bombarded with “Bet Builders” or...
May 17, 2026
Latency; in the world of high-stakes football betting, being “right” is only half the battle. You can have the most...
May 17, 2026
Easy Edges; in the sports betting world of 2026, the term “easy money” feels like a relic of a distant...
May 17, 2026
Bet Delay; for many football bettors, the transition from manual betting to full automation feels like the ultimate “level up.”...
May 17, 2026
Pressure Index; in the fast-paced world of in-play football betting, relying on basic statistics like “Total Shots” or “Corners” is...


Join the Discussion
We respect your privacy — your email won’t be shown. Fields marked * are required.