
May 17, 2026
7 Mistakes You’re Making with Overfitting Betting Models (and How to Fix Them)
Overfitting; the dream of every data-driven bettor is a “perfect” system. We open a tool like the Predictology Strategy Builder,...
If you have spent any time on a sportsbook app lately, you have probably been bombarded with “Bet Builders” or “Same Game Parlay” (SGP) prompts. They are flashy, they offer huge potential payouts for a small stake, and they are mathematically one of the biggest profit drivers for bookmakers in the modern era. At Predictology, […]
If you have spent any time on a sportsbook app lately, you have probably been bombarded with “Bet Builders” or “Same Game Parlay” (SGP) prompts. They are flashy, they offer huge potential payouts for a small stake, and they are mathematically one of the biggest profit drivers for bookmakers in the modern era.
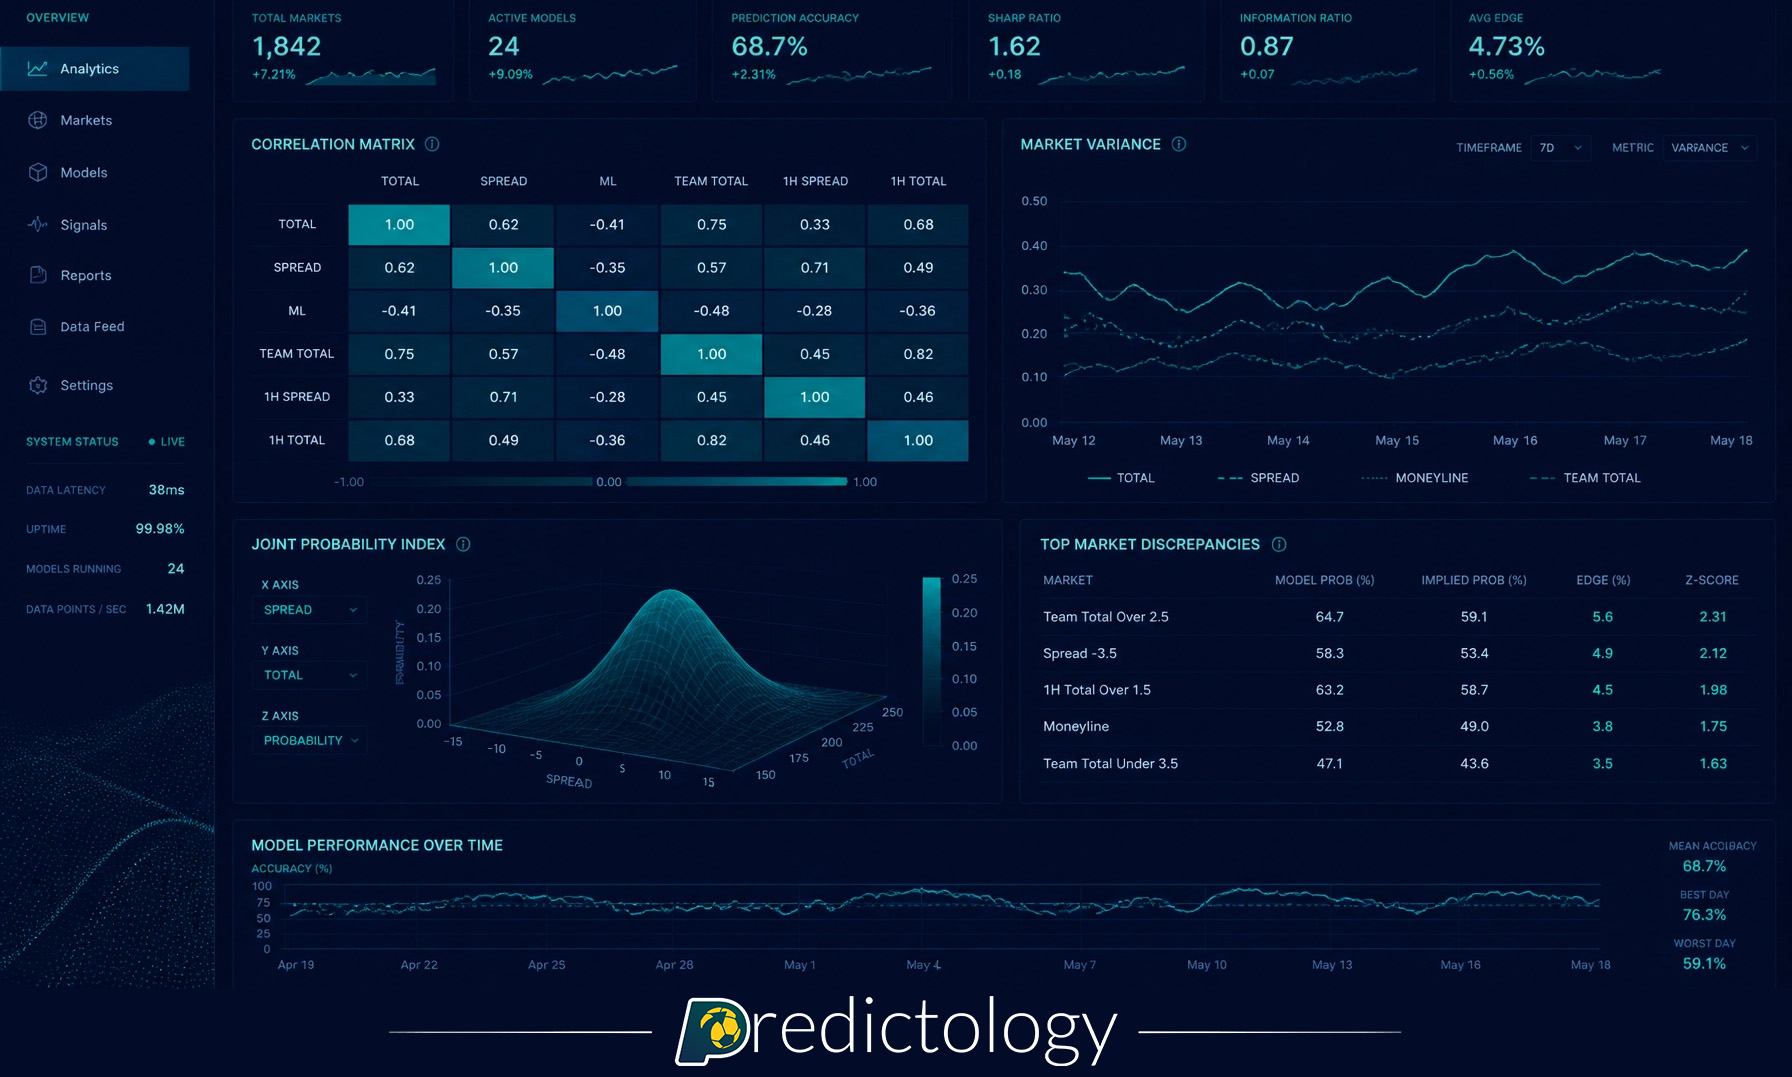
At Predictology, we are all about finding a competitive edge through data. To do that, you have to look past the marketing and dive into the numbers. The reality of Bet Builders is a complex mix of joint probability, correlation matrices, and heavily inflated house margins.
In this guide, we are going to strip back the curtain on how these bets are priced and show you where the real value lies: and it is rarely where the bookie says it is.
When you place a standard parlay (accumulator) on two separate matches: say, Arsenal to win and Real Madrid to win: the outcomes are independent. Arsenal winning has no statistical impact on whether Real Madrid wins. In this scenario, the bookie simply multiplies the odds of each (minus their standard margin).
However, in a Bet Builder, you are betting on events within the same match. These events are dependent. If you bet on “Manchester City to Win” and “Erling Haaland to Score,” those two outcomes are positively correlated. If Haaland scores, the probability of City winning increases significantly.
Bookmakers know this. They don’t just multiply the odds; they apply a “correlation discount.”
To price a Bet Builder, bookies use complex models like the Gaussian Copula to determine the probability of multiple events happening simultaneously ($P(A \cap B)$).
Because the second event (Haaland scoring) is more likely if the first event (City winning) happens, the payout is slashed. The problem for the bettor is that bookies often “over-discount” these odds, taking a massive slice of equity for themselves.

One of the most striking things about Bet Builders is the house edge. For a standard single match result bet, most top-tier bookmakers operate on a margin (the “vig”) of around 4% to 6%.
When you move into the territory of Bet Builders, that margin sky-rockets. Because the math is harder for the average punter to calculate, bookies hide massive margins in the price. It is not uncommon to see Bet Builders with a theoretical house edge of 20% to 25%.
Every “leg” you add to a Bet Builder doesn’t just add potential profit; it compounds the house’s advantage. While a single bet requires you to overcome a small hurdle, a 4-leg Bet Builder is like trying to run a hurdle race where the hurdles get higher with every step.
At Predictology, we focus on +EV (Expected Value) strategies. To be profitable long-term, your estimated probability of an event must be higher than the implied probability of the bookmaker’s odds. When the bookie is taking a 20% cut off the top, finding that +EV gap becomes nearly impossible.

If you are going to use Bet Builders, you need to understand how different events interact. There are two types of correlation you need to watch:
Bookmakers’ Bet Builder algorithms are excellent at discounting positive correlations, but they are sometimes less efficient at pricing negative correlations.
For example, if you bet on a “Team A to Win” but also “Team B Over 5.5 Corners,” these events aren’t strictly contradictory, but they often represent different game flows. If Team B is racking up corners, it usually means they are attacking and putting Team A under pressure, making a Team A win less likely.
Sometimes, the “boost” in odds you get for adding a negatively correlated leg is actually higher than the statistical risk, creating a rare window of +EV.

The best way to beat the Bet Builder is to stop guessing. Instead of looking at the odds the bookie gives you, use a data-driven approach to determine what the odds should be.
Using the Predictology System Builder, you can analyze over 400,000 matches to find the true frequency of correlated events.
By treating the Bet Builder as a data puzzle rather than a “lottery ticket,” you move from being a gambler to being a sports trader.
While we occasionally find value in multi-event pricing, the data is very clear: long-term bankroll growth is almost always more stable with high-volume single bets.
Our +EV Strategy Builder tracks over 20,000 bets, and the most consistent performers are those who identify mispriced single lines and exploit them relentlessly. Bet Builders are designed to trigger dopamine hits with “near misses,” whereas single-bet trading is a disciplined process of moving the needle 1% at a time.

If you want to move away from being the bookie’s favorite customer, you need to change your approach to Bet Builders:
Ready to stop guessing and start modeling? Join our community of data-driven bettors and get access to the Predictology LaunchPad to master the math of the markets.
May 17, 2026
Overfitting; the dream of every data-driven bettor is a “perfect” system. We open a tool like the Predictology Strategy Builder,...
May 17, 2026
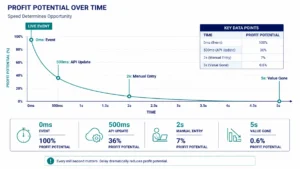
Latency; in the world of high-stakes football betting, being “right” is only half the battle. You can have the most...
May 17, 2026
Easy Edges; in the sports betting world of 2026, the term “easy money” feels like a relic of a distant...
May 17, 2026
Bet Delay; for many football bettors, the transition from manual betting to full automation feels like the ultimate “level up.”...
May 17, 2026
Pressure Index; in the fast-paced world of in-play football betting, relying on basic statistics like “Total Shots” or “Corners” is...
May 17, 2026
Overfitting; the dream of every data-driven bettor is a “perfect” system. We open a tool like the Predictology Strategy Builder,...
May 17, 2026
Latency; in the world of high-stakes football betting, being “right” is only half the battle. You can have the most...
May 17, 2026
Easy Edges; in the sports betting world of 2026, the term “easy money” feels like a relic of a distant...
May 17, 2026
Bet Delay; for many football bettors, the transition from manual betting to full automation feels like the ultimate “level up.”...
May 17, 2026
Pressure Index; in the fast-paced world of in-play football betting, relying on basic statistics like “Total Shots” or “Corners” is...


Join the Discussion
We respect your privacy — your email won’t be shown. Fields marked * are required.