June 17, 2026
Beyond the Full-Time Result: Profiting from 1st Half Goals and xG Trends
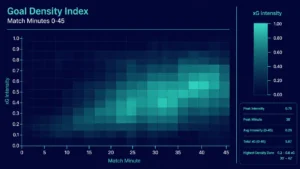
Expected Goals (xG); many recreational bettors spend their Saturday afternoons fixated on the final whistle. They track full-time results, late...
Build your own profitable football betting models from scratch. Our proven framework covers data analysis, system building, and backtesting for consistent betting results.
For the majority of bettors, Sunday afternoon is spent following a “gut feeling” or reacting to the latest news cycle. For the professional, however, Sunday is merely the data collection phase for a system that was built weeks, months, or even years ago.
Building a football betting model from scratch is the transition from gambling to sports investing. It is the process of removing emotion and replacing it with a mathematical edge. While the term “modeling” can sound intimidating, it is essentially a structured way of asking a question: Based on everything we know about these two teams, what is the true probability of a specific outcome?
This guide outlines a proven seven-step framework to help you build, test, and deploy a profitable football betting model.
The biggest mistake novice modelers make is trying to “beat the bookie” at everything simultaneously. A model that tries to predict the Match Result (1×2), Total Goals, and Asian Handicaps for every league in Europe will likely suffer from noise and lack of focus.
Profitability is often found in the corners of the market where bookmakers have less of a data advantage. Instead of the English Premier League, consider secondary leagues or specific markets like “Both Teams to Score” (BTTS) or first-half goal totals.
Your objective must be measurable. Rather than saying “I want to win more bets,” your objective should be: “To identify value in the Over 2.5 Goals market in the German Bundesliga with a minimum ROI of 5% over 500 bets.”

A model is only as good as the data fed into it. To build a framework that lasts, you need to decide which metrics actually correlate with winning.
Traditional stats, like league position, recent form (W-D-L), and goals scored, are already baked into the bookmakers’ odds. To find an edge, you need to look deeper.
You can source data through APIs, manual scraping, or dedicated platforms like Predictology, which provide clean, historical football data ready for analysis. Clean data is non-negotiable; a single missing result or an incorrect scoreline can skew your entire distribution.
Once you have your data, you need a way to process it. There are several common types of models used in football betting:
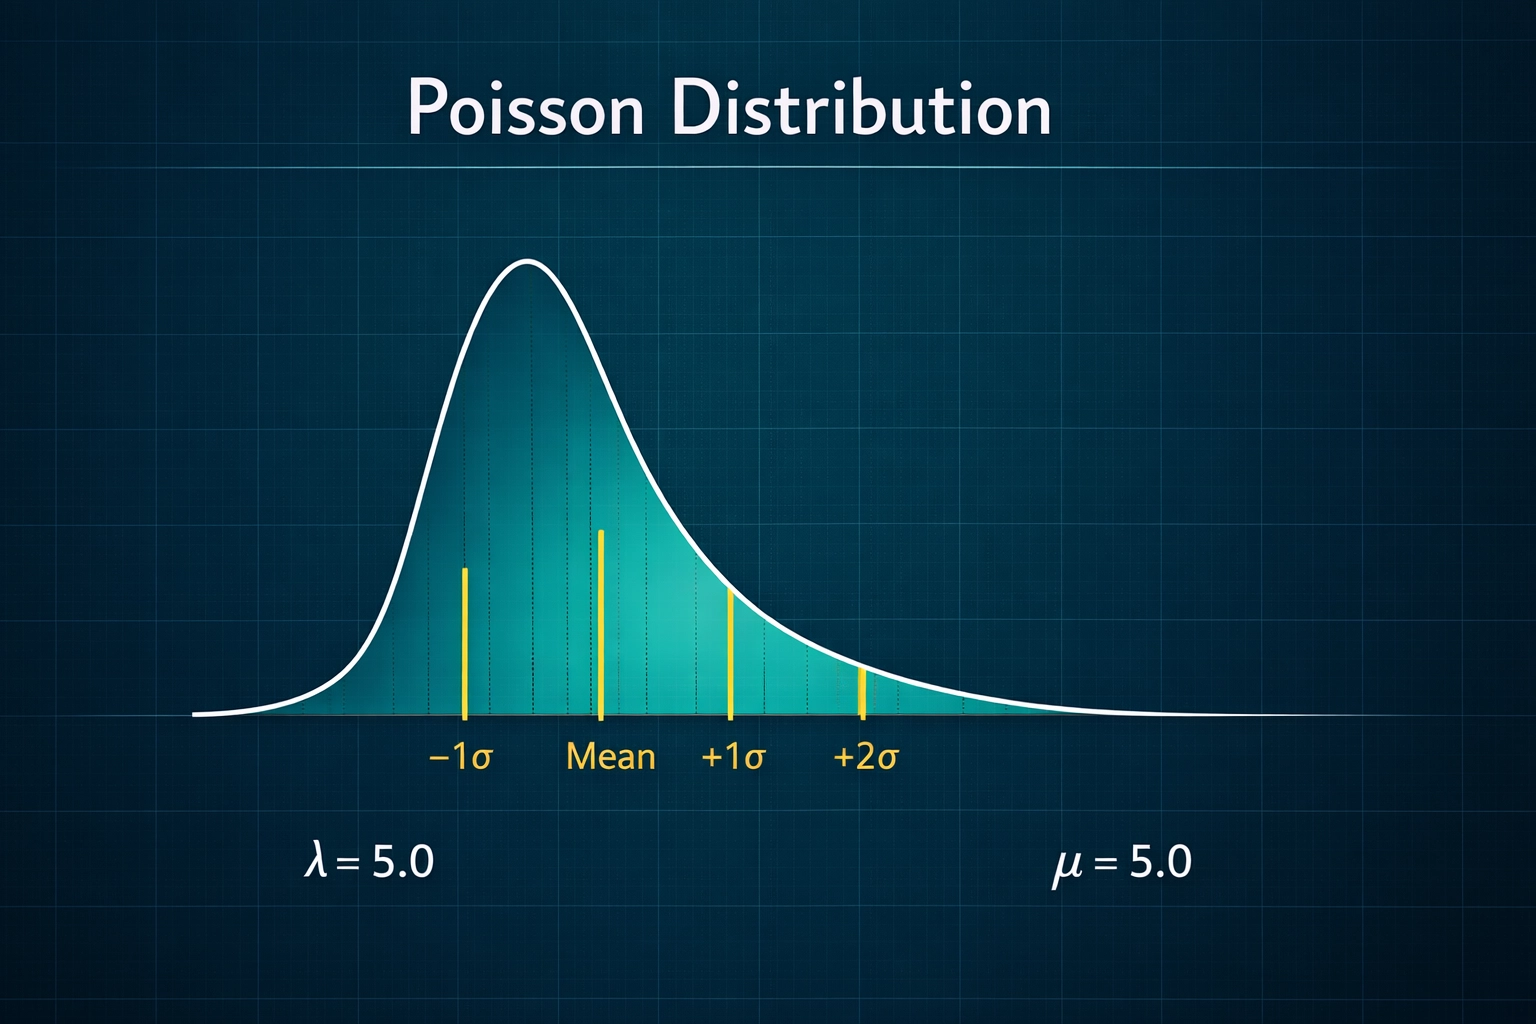
This is the “gold standard” for goal-based modeling. Because goals in football occur randomly but at a measurable average rate, the Poisson distribution allows you to calculate the probability of a team scoring 0, 1, 2, or 3+ goals. By comparing the offensive strength of Team A against the defensive weakness of Team B, you can generate an “Expected Scoreline.”
Elo ratings (originally from chess) assign a numerical value to a team’s strength. When Team A beats Team B, points are transferred from the loser to the winner. The number of points transferred depends on the relative difference in their ratings. This is excellent for ranking teams across different leagues.
Linear or logistic regression helps you determine the relationship between an independent variable (like shots on target) and a dependent variable (like winning the match). This tells you *which* stats actually matter for winning.
You don’t need a PhD in computer science to build a model. Most professional bettors start in Microsoft Excel or Google Sheets.
1. **Input Tab:** Where you paste your raw data.
2. **Calculation Tab:** Where your formulas (Poisson, Elo, etc.) live.
3. **Output Tab:** Where the model gives you a percentage probability for a home win, draw, or away win.
4. **Odds Comparison:** Where you convert those percentages into “Fair Odds” (1 / Probability) and compare them to the available market prices.
As your skills grow, you might migrate to Python or R for more complex machine-learning applications, but the logic remains the same.
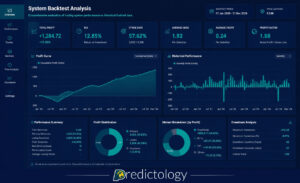
Before you risk a single penny, you must prove that your model would have worked in the past. This is known as backtesting.
A common trap is “overfitting” your model to historical data. This happens when you add so many variables that the model perfectly predicts what *did* happen but fails to predict what *will* happen. If your model is too specific to the 2023 season, it might fail in 2026.
When validating your strategy, ensure you have a significant sample size, usually at least 200–500 bets. You should also learn how to avoid the biggest backtesting pitfalls to ensure your results aren’t just a statistical fluke.

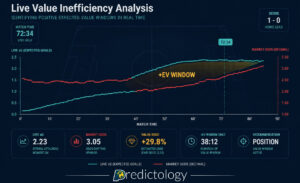
Your model’s job isn’t to pick winners; it’s to find price discrepancies. This is the concept of Expected Value (+EV).
If your model calculates that Manchester City has a 75% chance of winning, the “Fair Odds” should be 1.33. If a bookmaker is offering 1.45, you have found a +EV bet.
The formula for EV is:
(Probability of Winning × Amount Won per Bet) – (Probability of Losing × Amount Lost per Bet)
If the result is positive, the bet is mathematically sound. Over the long term, consistently hitting +EV bets is the only way to remain profitable. For a deeper look, see our ultimate guide to EV betting.
Even the best model in the world will have losing streaks. This is known as variance. Without a staking plan, a 10-bet losing streak could wipe out your bankroll, even if your model is fundamentally correct.
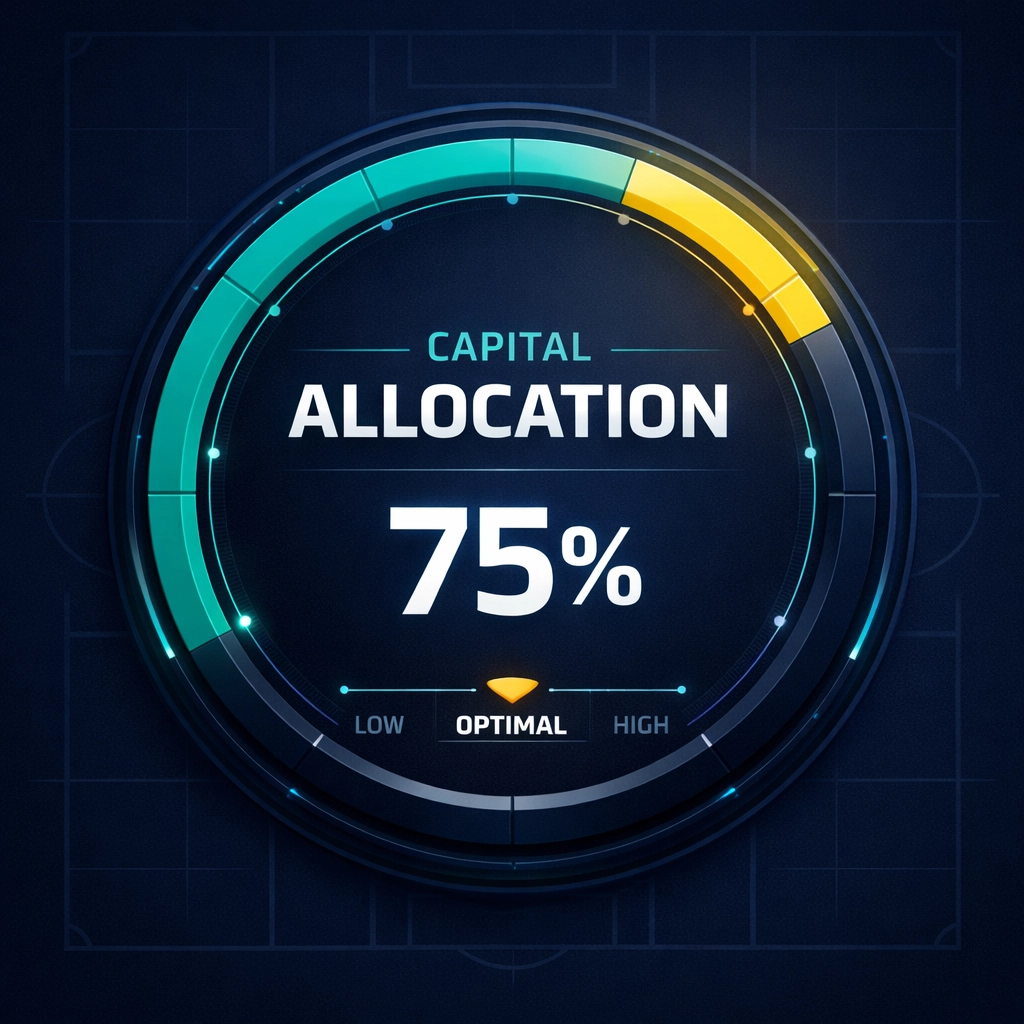
Many modelers use the Kelly Criterion to determine bet size. It calculates the optimal percentage of your bankroll to wager based on the size of your “edge.”
* **Edge:** (Model Probability × Decimal Odds) – 1
* **Staking %:** Edge / (Decimal Odds – 1)
Most professionals use a “Fractional Kelly” (e.g., 1/4 or 1/2 Kelly) to reduce volatility and protect their capital.
The ultimate metric for a football modeler is not your bankroll balance, at least not in the short term. It is Closing Line Value (CLV).
If you bet on a team at 2.00 and they “close” (the final price before kick-off) at 1.80, you have beaten the market. If you consistently beat the closing line, you are almost guaranteed to be profitable in the long run, as the closing line is the most accurate reflection of the “true” probability.
If your model consistently suggests bets that move *against* you (e.g., you bet at 2.00 and it closes at 2.20), your model is likely missing a key variable that the market is capturing. This is your signal to return to Step 2 and refine your variables.
Continuous improvement is the hallmark of a profitable bettor. Learn more about backtesting betting strategies to keep your model sharp.
Building a profitable model is a marathon, not a sprint. Do not try to build a complex machine-learning algorithm on day one.
Your Next Step: Pick one league (e.g., the EFL Championship) and one market (e.g., Over 1.5 Goals). Collect the xG data for the last two seasons and apply a simple Poisson distribution. Compare your “Fair Odds” to the actual historical results.
By starting with a narrow focus, you can master the mechanics of modeling without the noise of the wider market. Once you have a framework that shows a paper-trading profit, you can begin to scale your operation with confidence.
June 17, 2026
Expected Goals (xG); many recreational bettors spend their Saturday afternoons fixated on the final whistle. They track full-time results, late...
June 17, 2026
In the world of football betting, 2026 marks a significant turning point. Just a few years ago, Expected Goals (xG)...
June 17, 2026
Expected Value (+EV) For the majority of football bettors, the live market is a whirlwind of emotion, reaction, and guesswork....
June 17, 2026
System Builder; for most football bettors, the journey starts with a gut feeling. You see a home team with a...
June 17, 2026
Analytics; to move from a casual punter to a professional bettor, you must transition from making “picks” to executing a...
June 17, 2026
Expected Goals (xG); many recreational bettors spend their Saturday afternoons fixated on the final whistle. They track full-time results, late...
June 17, 2026
In the world of football betting, 2026 marks a significant turning point. Just a few years ago, Expected Goals (xG)...
June 17, 2026
Expected Value (+EV) For the majority of football bettors, the live market is a whirlwind of emotion, reaction, and guesswork....
June 17, 2026
System Builder; for most football bettors, the journey starts with a gut feeling. You see a home team with a...
June 17, 2026
Analytics; to move from a casual punter to a professional bettor, you must transition from making “picks” to executing a...


Join the Discussion
We respect your privacy — your email won’t be shown. Fields marked * are required.