April 21, 2026
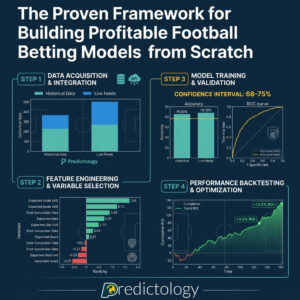
The Proven Framework for Building Profitable Football Betting Models from Scratch
Build your own profitable football betting models from scratch. Our proven framework covers data analysis, system building, and backtesting for...
xG; in the world of sports betting, the final score of a football match is often the least reliable piece of data for predicting future results. While the scoreboard determines who gets the three points, it frequently masks the underlying reality of how the game was played. A team can win 2-0 while being thoroughly […]
xG; in the world of sports betting, the final score of a football match is often the least reliable piece of data for predicting future results. While the scoreboard determines who gets the three points, it frequently masks the underlying reality of how the game was played. A team can win 2-0 while being thoroughly outplayed, just as a dominant side can lose 1-0 due to a single defensive lapse or a “wonder goal” from thirty yards.
For the serious bettor, success lies in identifying the discrepancy between perception: driven by scorelines: and reality: driven by performance metrics. This is where Expected Goals (xG) and the concept of performance regression become the most powerful tools in your analytical arsenal.
Football is a low-scoring, high-variance sport. Because goals are rare events, a single moment of luck can have a disproportionate impact on the outcome of a match. If you base your betting strategy solely on wins, losses, and draws, you are essentially betting on noise.
The market often overreacts to recent results. A team that has won three games in a row will see their odds shorten in the fourth match, regardless of whether those wins were “earned” through dominant play or “stolen” through clinical finishing and a bit of luck. Professional bettors look past the result to the “process.” If the process is strong, the results will eventually follow. If the process is weak, a correction: or regression: is inevitable.
Expected Goals (xG) is a statistical measure that assigns a value to every scoring opportunity based on the probability of it resulting in a goal. This value is typically a figure between 0 and 1.
A variety of factors influence the xG of a shot:
For context, a penalty kick is generally assigned an xG of approximately 0.79, reflecting a 79% historical conversion rate. A speculative long-range effort might carry an xG of just 0.02. By aggregating these values over 90 minutes, we get a much clearer picture of which team created the better chances, regardless of how many times the ball actually hit the net.

The core of a data-driven betting strategy at Predictology involves finding teams whose actual results are out of sync with their xG data. This state of imbalance is where the most profitable betting opportunities reside.
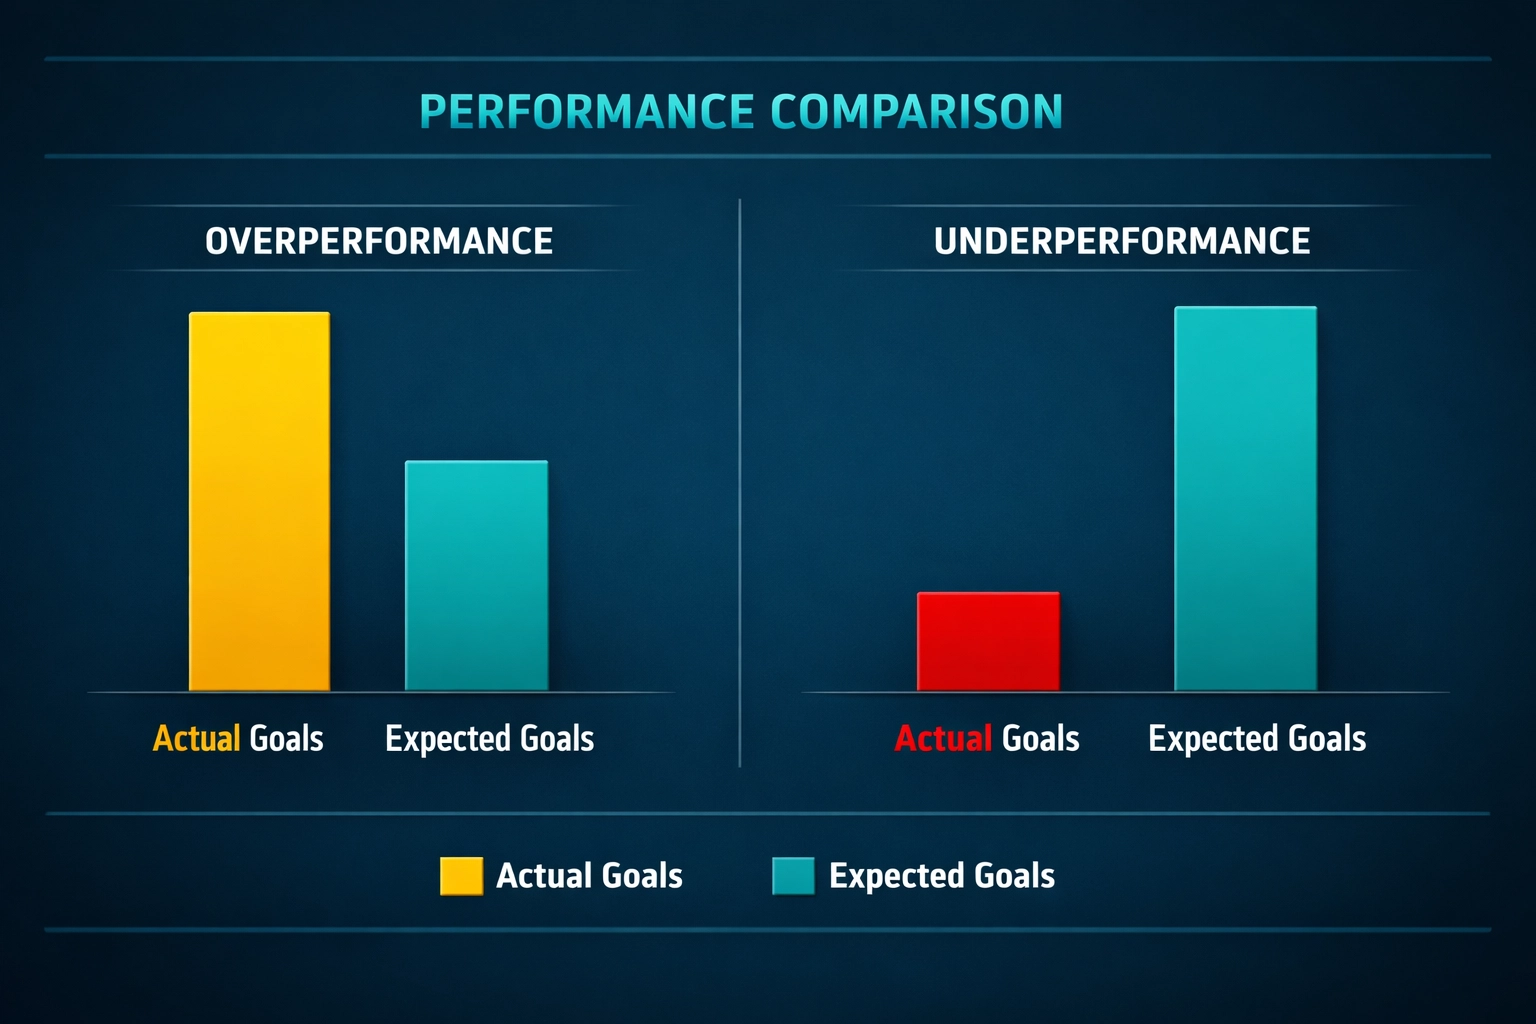
When a team consistently wins matches despite generating low xG and conceding high xG, they are overperforming. This usually happens because of “hot” finishing (scoring difficult chances) or “hot” goalkeeping (saving high-quality shots).
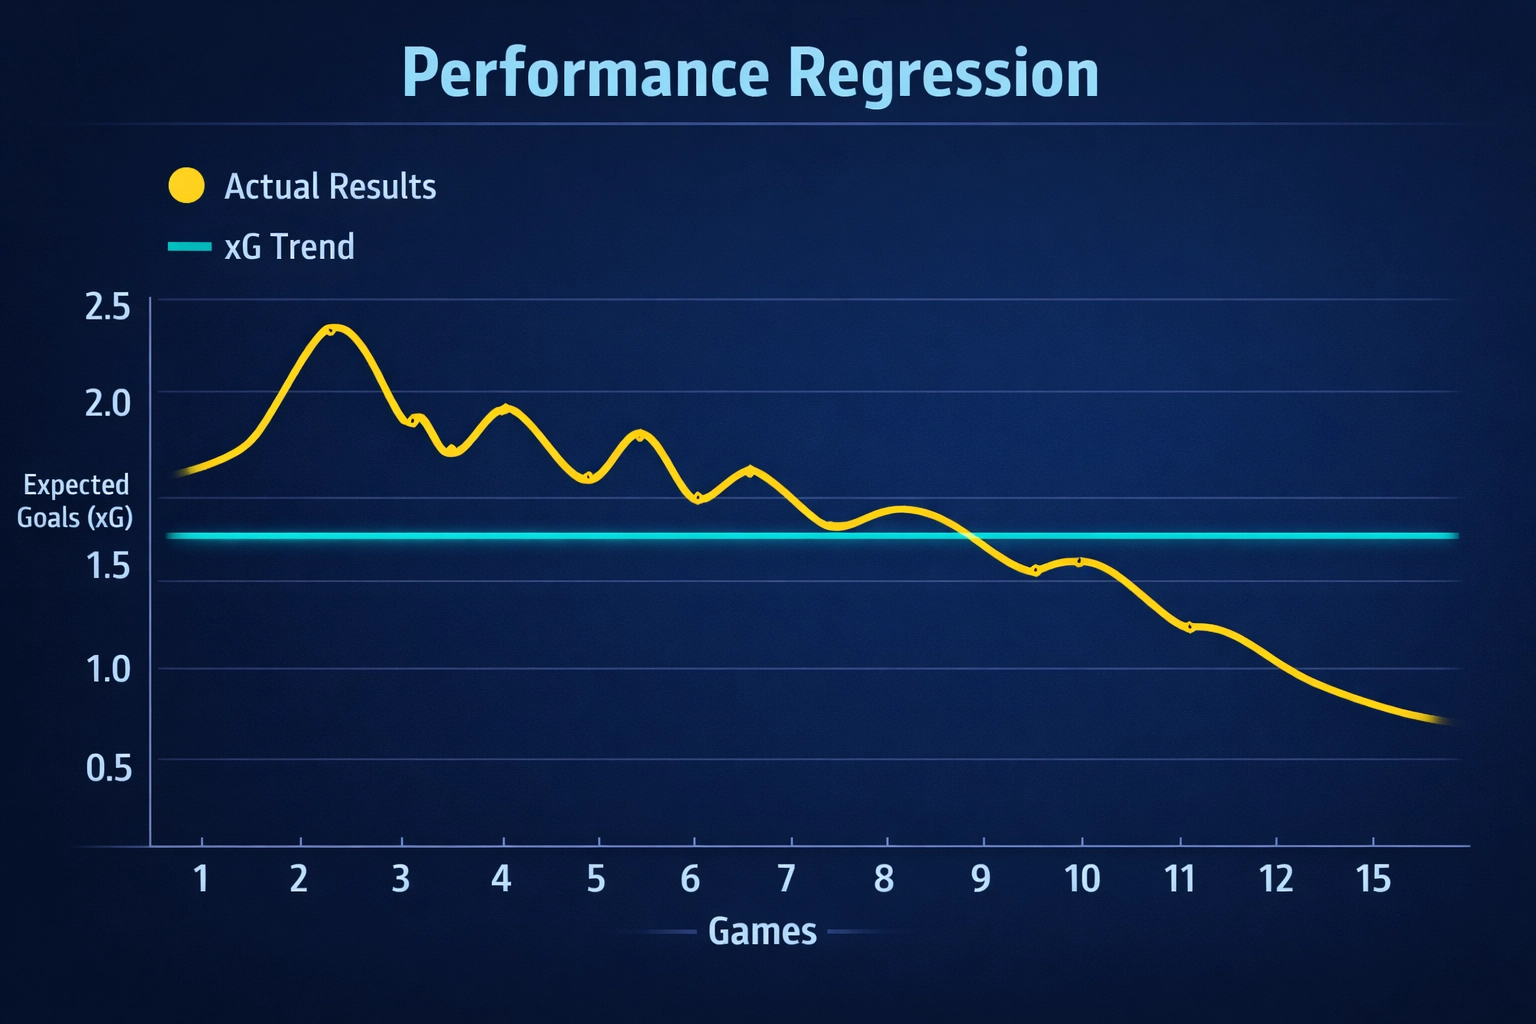
Statistically, neither of these is sustainable over a long period. Regression tells us that their goal-scoring will eventually cool down to match their xG creation. Because the public and the bookmakers often price these teams based on their recent win streak, their odds are frequently shorter than they should be. This creates value in betting against them or taking the “Lay” side on an exchange.
Conversely, teams that generate high xG but fail to win matches are underperforming. They might hit the post, face an inspired goalkeeper, or simply lack composure in the final third.
The betting market tends to sour on these teams, leading to drifting odds and higher prices. However, if the underlying process: creating high-quality chances: remains consistent, the goals will eventually come. These teams are the “goldmine” for sharp bettors. By backing an “unlucky” team before the market realizes their performance is actually elite, you capture a massive amount of Expected Value (+EV).
To find these opportunities, you need to look at the “Goal-Gap”: the difference between a team’s Actual Goals (AG) and their Expected Goals (xG).
Data models suggest that when a team’s actual goal count exceeds their xG by more than 30% over a 10-game sample, they are highly likely to experience a downward regression in results. On the flip side, if a team’s goals are 30% lower than their xG, an upward surge in form is statistically probable.
It is important to use a sufficient sample size. A single game is too volatile; xG in one match can be skewed by a single red card or a specific tactical anomaly. However, once you have 10 to 15 games of data, the xG trends become highly predictive. Research has shown that xG-based models outperform goal-based models in predicting future performance in 8 out of 10 cases.
At Predictology, we provide the tools to automate this analysis so you don’t have to spend hours over spreadsheets. By using our features, you can set up filters to identify these specific regression spots across dozens of global leagues.
Use our database to find matches where there is a significant delta between a team’s league position and their “Expected Points” (xPts) based on xG. If a team is 4th in the table but 12th in xPts, you have found a prime candidate to bet against.
xG performance can vary wildly based on venue. Some teams are excellent at creating high-value transitions away from home but struggle to break down low blocks in their own stadium. Ensure your regression analysis accounts for these splits to avoid betting into a “false” trend.
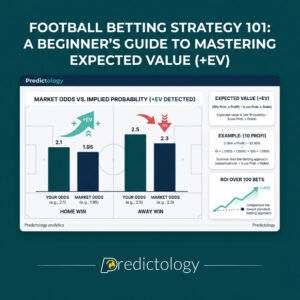
Once you have identified a team due for regression, calculate what the odds should be based on their xG performance. If your calculated “fair price” for a home win is 2.00 (50%), but the bookmaker is offering 2.30 (43.5%), you have a clear value bet.
While xG is a revolutionary metric, a professional analyst must also recognize its limitations. It is not a magic bullet.
To learn more about common pitfalls in data-driven betting, check out our guide on 7 mistakes you’re making with betting automation.
The goal of using xG and performance regression isn’t to predict what will happen in a single game with 100% certainty: that is impossible in football. The goal is to ensure that every time you place a bet, the probability of the outcome is higher than the probability implied by the odds.
By focusing on the underlying quality of chances rather than the noise of the final score, you separate yourself from the casual betting public. You stop chasing “form” and start betting on “probability.”
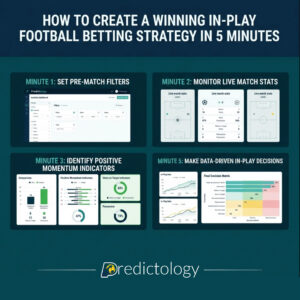
To begin implementing this strategy today, follow this simple framework:
The market will always be reactive. By staying disciplined and trusting the data of performance regression, you put yourself in a position to capitalize when the scoreline lies.
April 21, 2026
Build your own profitable football betting models from scratch. Our proven framework covers data analysis, system building, and backtesting for...
April 21, 2026
Looking for the best value betting software? Before you buy, read our guide on the 10 essential things you need...
April 21, 2026
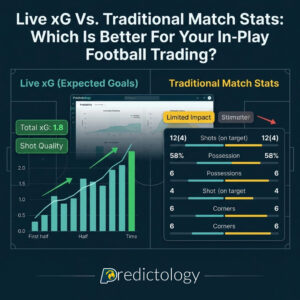
The Evolution of In-Play Data Live xG; for decades, in-play football trading was guided by a combination of the “eye...
April 21, 2026
Expected Value +EV; most football fans approach betting with a single question: “Who is going to win this match?” If...
April 21, 2026
In-Play Football Betting; in the world of professional sports trading, the transition from pre-match analysis to in-play execution is where...
April 21, 2026
Build your own profitable football betting models from scratch. Our proven framework covers data analysis, system building, and backtesting for...
April 21, 2026
Looking for the best value betting software? Before you buy, read our guide on the 10 essential things you need...
April 21, 2026
The Evolution of In-Play Data Live xG; for decades, in-play football trading was guided by a combination of the “eye...
April 21, 2026
Expected Value +EV; most football fans approach betting with a single question: “Who is going to win this match?” If...
April 21, 2026
In-Play Football Betting; in the world of professional sports trading, the transition from pre-match analysis to in-play execution is where...

Join the Discussion
We respect your privacy — your email won’t be shown. Fields marked * are required.