July 26, 2026
Beyond the Full-Time Result: Profiting from 1st Half Goals and xG Trends
Expected Goals (xG); many recreational bettors spend their Saturday afternoons fixated on the final whistle. They track full-time results, late...
xG; for decades, football traders relied on a mixture of “the eye test” and basic statistics like possession percentages or shot counts. While these metrics provided a surface-level view of a match, they often masked the underlying reality of what was happening on the pitch. A team could have 70% possession and 10 shots, but if those shots were speculative efforts from 30 yards out, their actual chance of scoring remained low.
The introduction of Expected Goals (xG) changed the pre-match landscape forever. However, the real revolution is happening now, in the live environment. Using in-play xG stats is no longer just an “advanced” tactic: it is becoming the baseline for anyone serious about Inplay football betting.
At Predictology, we view data as the ultimate equalizer against the bookmaker’s margin. By understanding how to interpret live performance data, you can move away from reactive gambling and toward proactive, systematic trading.
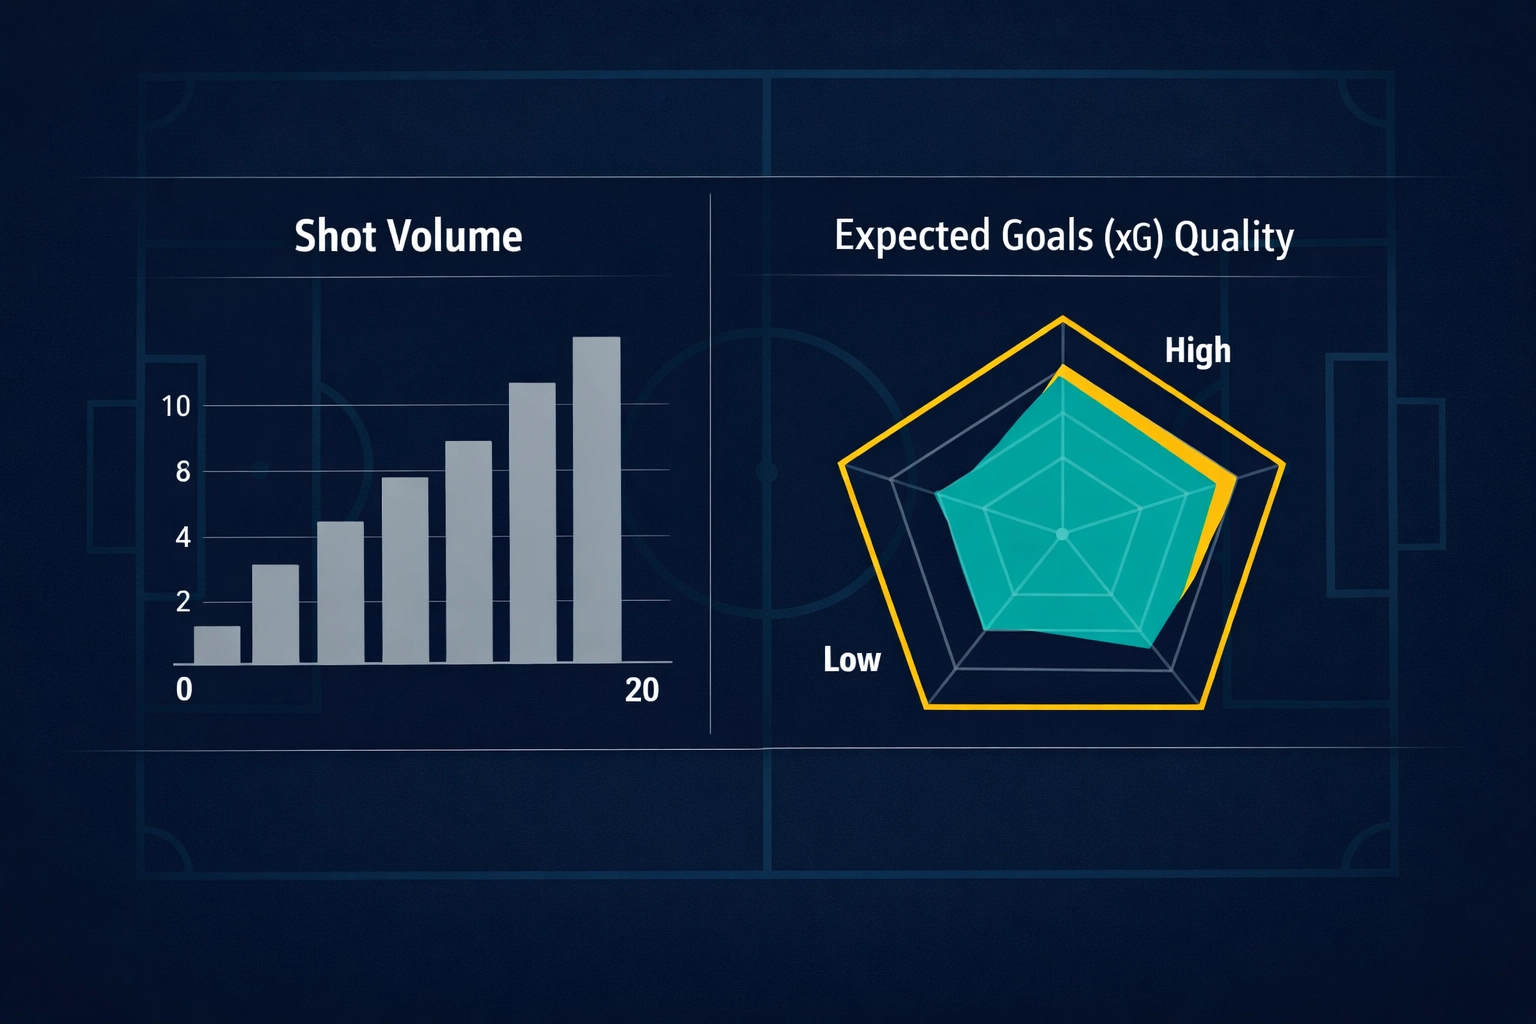
In the early days of sports analytics, “shots on target” was the gold standard. Traders would look for a high volume of shots to indicate momentum. But as the game has become more tactically complex, the volume of shots has become a noisy, often unreliable metric.
Expected Goals (xG) filters out that noise by assigning a value to every shot based on its probability of resulting in a goal. A penalty has an xG of 0.76, while a header from the edge of the box might be as low as 0.02. In a live environment, football xG stats allow you to see the “weight” of the pressure a team is exerting.
Traditional live stats provided by bookmakers are often designed to encourage betting, not necessarily to inform the trader. Possession can be passive; corners can lead to nothing. In-play xG, however, tells you exactly how much “danger” a team is creating.
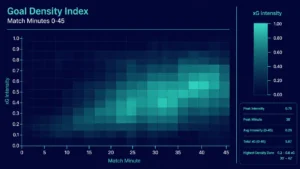
When you track xG in real-time, you aren’t just seeing what has happened (the scoreline); you are seeing what should be happening. This distinction is where the profit lies. If the score is 0-0 but the home team has accumulated 1.2 xG by the 30th minute, the market may still be pricing the “Under” markets based on the lack of goals. This creates a clear value entry point.
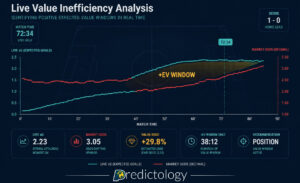
One of the most significant advantages of using live xG is timing. The betting markets, particularly on high-liquidity exchanges like Betfair, are incredibly efficient at reacting to goals, red cards, and injuries. However, they are often slower to react to subtle shifts in match momentum.
Price movement often lags behind xG changes. If a team suddenly increases their intensity and creates two “big chances” in five minutes, their xG will spike. It takes time for the market’s “weight of money” to adjust the odds to reflect this increased probability of a goal. Professional traders exploit this window.
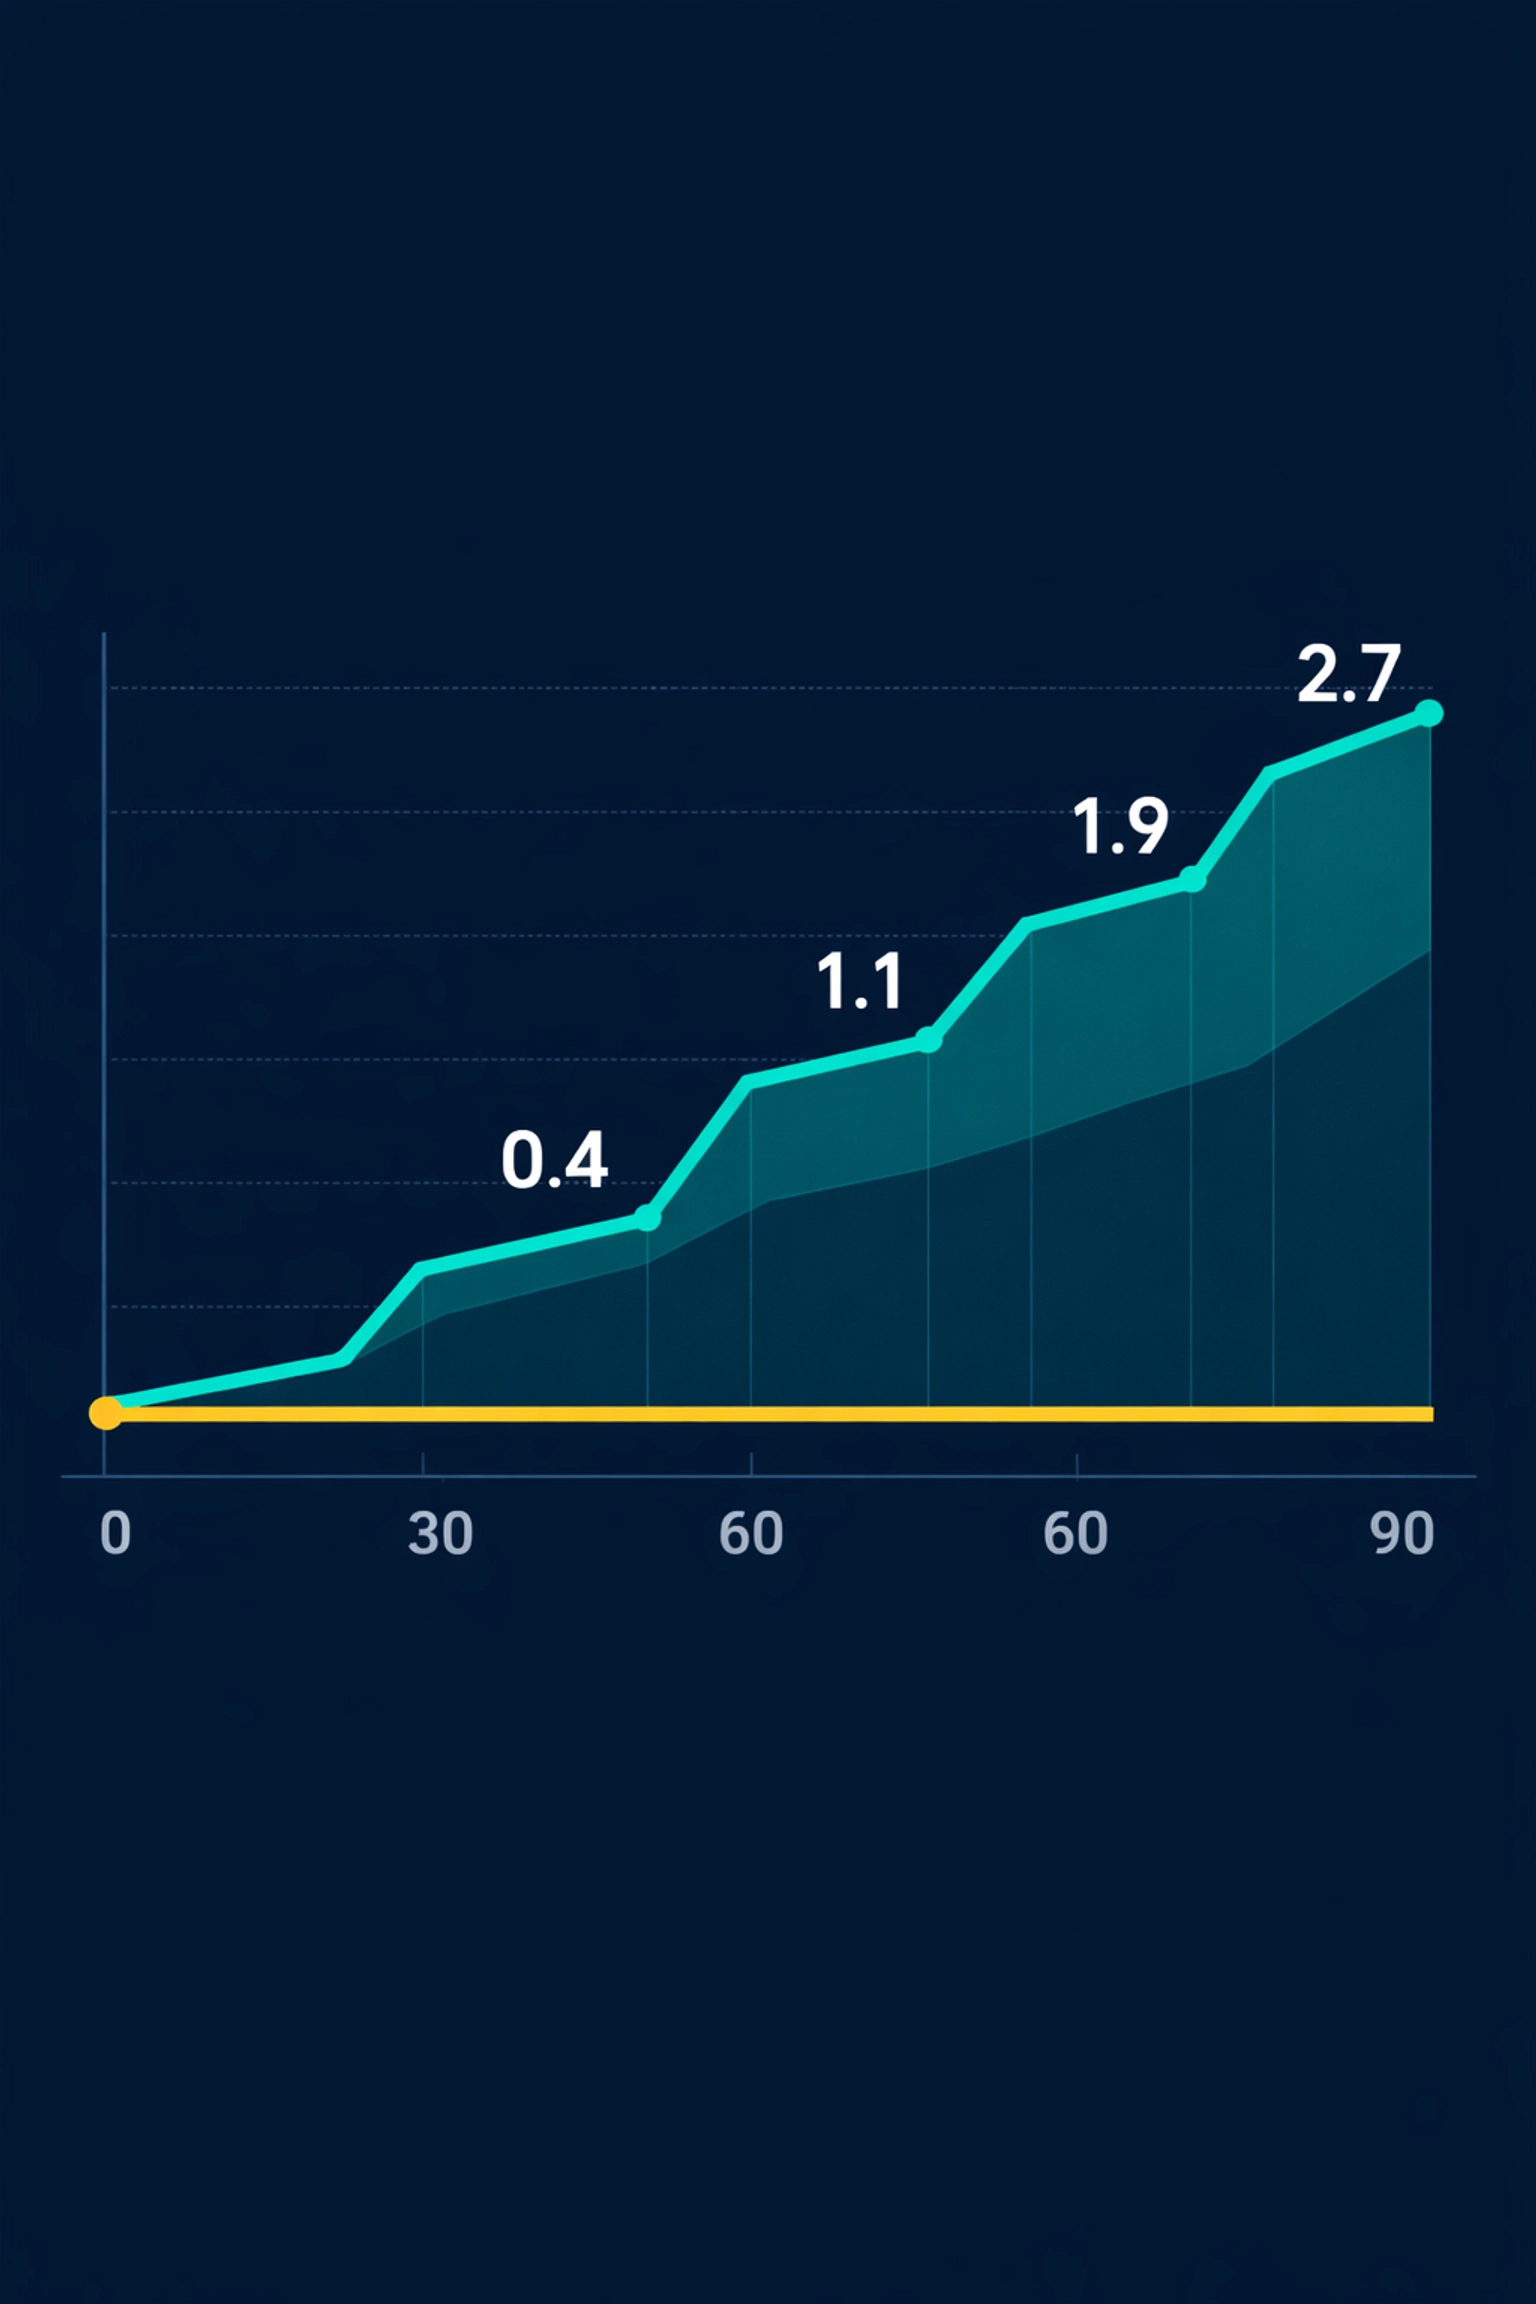
In-play xG represents “seeing smoke before discovering the fire.” It is a leading indicator. For example, consider a match that is 0-0 at the 15th minute with a combined xG of 0.3. By halftime, the score remains 0-0, but the cumulative xG has reached 1.1.
Most casual bettors see a boring 0-0 and might look to trade the “Under” or the draw. A data-driven trader sees a match that is “due” a goal based on the quality of chances created. By positioning yourself in the Over 1.5 or “Next Goal” markets before the market fully adjusts to the attacking intensity, you secure a price with a higher value betting potential.
Inplay football betting is often about identifying the right time to enter or exit a position in the goals markets. xG provides a objective framework for these decisions.
The Over/Under markets are the bread and butter of football trading. By using football xG stats, you can identify matches where the current odds do not reflect the offensive output.
Professional traders don’t look at markets in isolation. They use xG signals that align across Match Odds (1X2), Over/Under, and Asian Handicaps. If the xG is heavily skewed in favor of the away team, but the score is level, there is a divergence. This divergence is a signal to look at the “Away Draw No Bet” or “Next Goal Away” markets.
By using live dashboards: similar to those offered through Predictology’s features: traders can spot these discrepancies across dozens of leagues simultaneously.
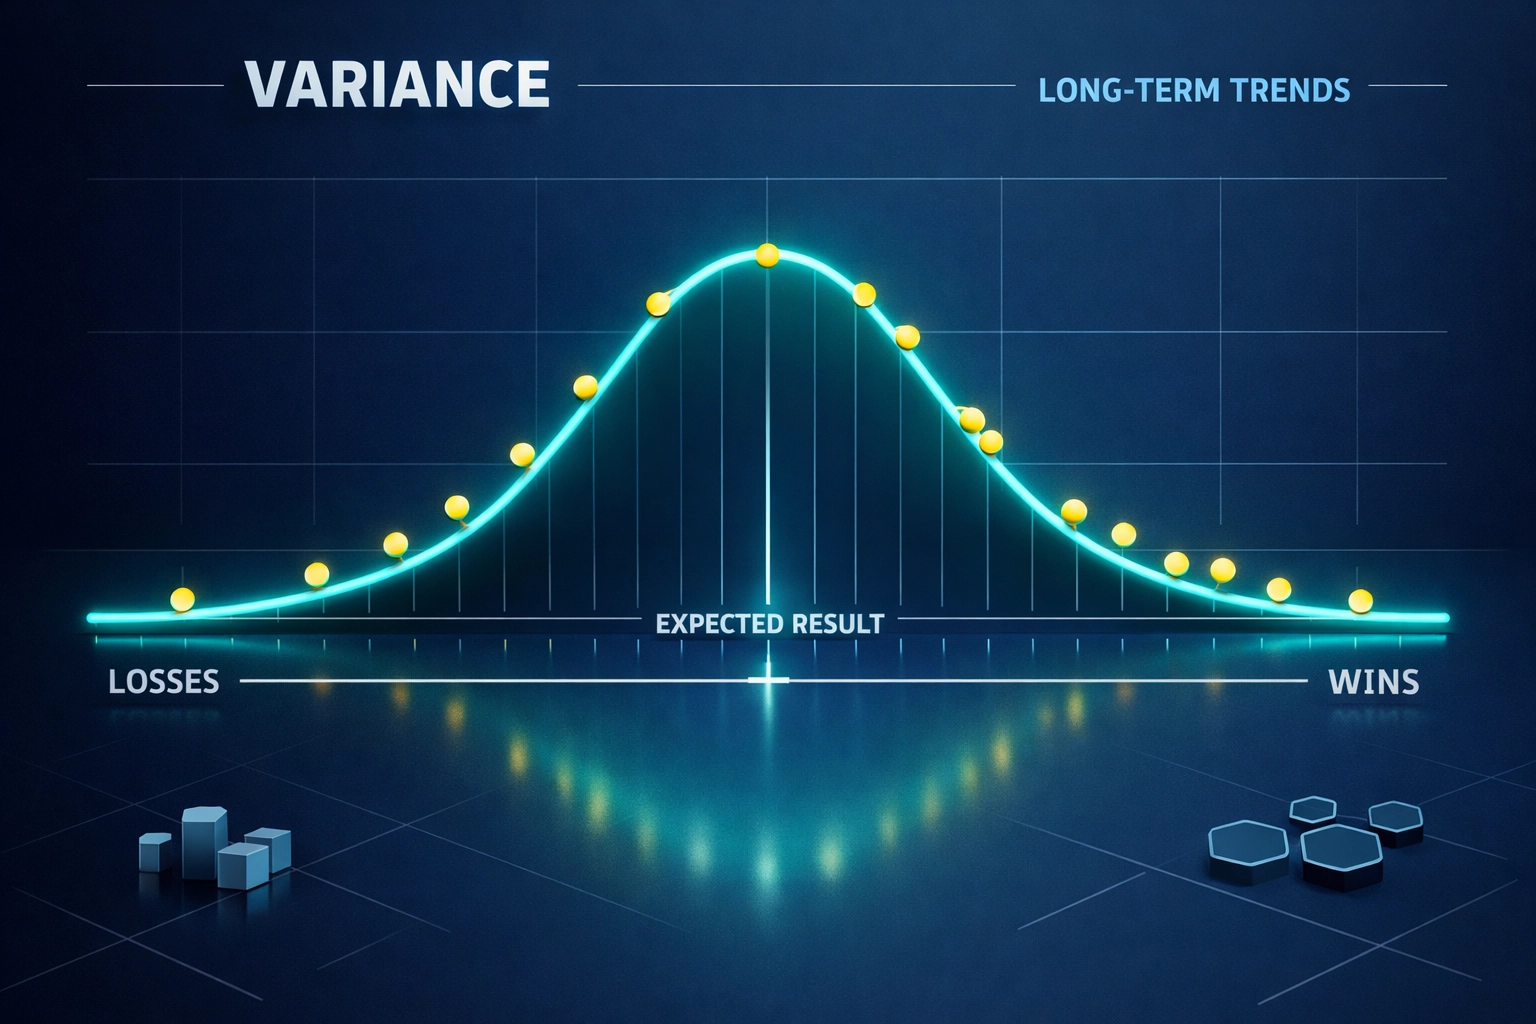
One of the hardest parts of trading is the emotional toll of a loss. When a team misses a “sitter” in the 90th minute and your “Over 2.5” bet fails, it’s easy to feel like the strategy is broken.
However, in-play xG shifts the focus from results to process. If you consistently enter trades where the xG supports a goal, you are making mathematically sound decisions. Even if an individual trade loses, the underlying logic remains valid. Over a sample of 1,000 trades, the variance will even out, and the edge provided by xG will manifest in your bankroll.
We are all prone to cognitive biases. We might remember a team’s great performance from last week and assume they will repeat it today, even if they look sluggish on the pitch. Or, we might be swayed by a commentator’s narrative.
Live xG is cold and objective. It doesn’t care about reputations or previous results. It only cares about where the ball is being kicked from and the likelihood of it hitting the back of the net. This objectivity is essential for maintaining a professional trading mindset.
To truly change the way you trade, you need to integrate these stats into a repeatable workflow. Watching one game and looking at one xG chart is a start, but the real power comes from scale.
Many professional traders now use betting automation to execute trades when certain xG thresholds are met. For example, a bot could be programmed to “Back the Draw” if the xG difference between two teams remains within 0.2 after 70 minutes, or to “Back Over 0.5 Second Half Goals” if the combined xG in the first 10 minutes of the second half exceeds a specific value.
While xG is a powerful tool, it is not a crystal ball. It does not account for:
A successful trader uses football xG stats as the core of their analysis but layers it with context and market knowledge.
The era of “guessing” in football trading is over. If you want to move from being a hobbyist to a professional, you must embrace the data.
Start by doing the following:
By focusing on the probability of events rather than the outcome of a single match, you align yourself with the math of the markets. For those ready to take their data analysis to the next level, exploring Predictology’s insights and tutorials is the logical next step in mastering the art of the trade.
July 26, 2026
Expected Goals (xG); many recreational bettors spend their Saturday afternoons fixated on the final whistle. They track full-time results, late...
July 26, 2026
In the world of football betting, 2026 marks a significant turning point. Just a few years ago, Expected Goals (xG)...
July 26, 2026
Expected Value (+EV) For the majority of football bettors, the live market is a whirlwind of emotion, reaction, and guesswork....
July 26, 2026
System Builder; for most football bettors, the journey starts with a gut feeling. You see a home team with a...
July 26, 2026
Analytics; to move from a casual punter to a professional bettor, you must transition from making “picks” to executing a...
July 26, 2026
Expected Goals (xG); many recreational bettors spend their Saturday afternoons fixated on the final whistle. They track full-time results, late...
July 26, 2026
In the world of football betting, 2026 marks a significant turning point. Just a few years ago, Expected Goals (xG)...
July 26, 2026
Expected Value (+EV) For the majority of football bettors, the live market is a whirlwind of emotion, reaction, and guesswork....
July 26, 2026
System Builder; for most football bettors, the journey starts with a gut feeling. You see a home team with a...
July 26, 2026
Analytics; to move from a casual punter to a professional bettor, you must transition from making “picks” to executing a...


Join the Discussion
We respect your privacy — your email won’t be shown. Fields marked * are required.