October 17, 2026
How Often Do Half-Time Leads Hold? 2026/27 vs the Last 10 Seasons
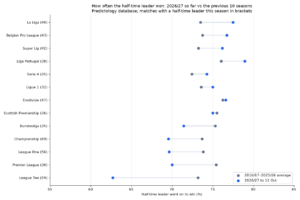
How often do half-time leads hold? Win, draw and defeat rates for half-time leaders in 13 leagues so far in...
Expected Goals (xG); many recreational bettors spend their Saturday afternoons fixated on the final whistle. They track full-time results, late drama, and 90-minute statistics. While there is certainly liquidity in the match odds market, professional analysts often look elsewhere to find an edge that the broader market overlooks. One of the most fertile grounds for data-driven profitability is the first half of the match.
Update, 14 October 2026: Autobet, which sent Predictology picks to BF Bot Manager, stops on 17 October 2026. The Bot Manager and automated-betting steps in this article won’t work with Predictology after that. Everything else in Predictology works as before.
By focusing on the opening 45 minutes, we can isolate specific team behaviors and Expected Goals (xG) trends that are often diluted by the chaotic nature of the second half. At Predictology, our System Builder allows you to strip away the noise and focus purely on the metrics that drive early goals. In this guide, we will break down the math behind the first half and show you how to build a robust model for early goal markets.
To trade the first half successfully, you must first understand the baseline probabilities. Across a massive sample of over 400,000 matches in the Predictology database, a clear pattern emerges. Roughly 74.8% of professional matches see at least one goal scored before the half-time whistle. This means that if you are backing “Over 0.5 First Half Goals,” you are entering a market where the outcome occurs three out of four times on average.
However, the distribution of these goals is not uniform. Goals are significantly more frequent in the final 15 minutes of the half than in the first 15. In fact, statistically, the interval between the 30th and 45th minute produces nearly 1.5 times more goals than the opening 15 minutes of play.

This timing skew is directly correlated with xG per minute efficiency. In the early stages of a match, teams are often “feeling each other out,” maintaining defensive structures and avoiding high-risk passes. As the half progresses, players tire, tactical gaps open, and the pressure to take a lead into the break increases.
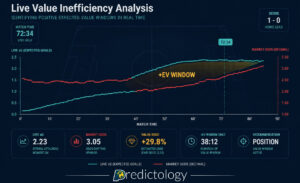
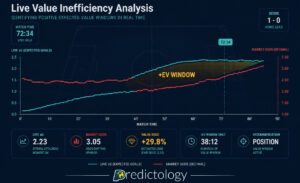
For a bettor, this creates a unique opportunity. If a match is still 0-0 at the 15 or 20-minute mark, the market price for “Over 0.5 First Half Goals” will drift upward significantly, yet the highest probability period for a goal is only just beginning. By using our Live Value Bet Finder, you can identify matches where the live xG generation remains high despite the scoreline remaining level.
The key to a profitable first-half strategy is not just betting on high-scoring teams, but finding specific conditions where early goals are statistically undervalued. Using the Predictology System Builder, we can filter through thousands of historical matches to find these pockets of value.

When constructing an early goal model, we recommend focusing on the following data points:
In the System Builder, try applying a filter for “Home Team FH Goals > 0.5” combined with “Away Team FH Goals Conceded > 0.5” over their last 10 matches. When both metrics align, the probability of an early goal jumps significantly above the league average. This is where you find your positive Expected Value (+EV).
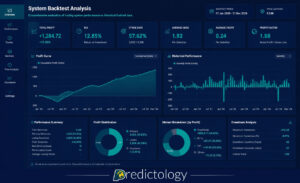
By backtesting these filters against our database of 400k+ matches, you can see exactly how a strategy would have performed over the last five seasons. This moves your betting from “gut feeling” to a rigorous statistical process. For more on why xG is the foundation of this process, check out our deep dive on why xG is only half the story.
While pre-match models provide the foundation, the real “gold” in first-half betting is often found in the live markets. Many professional traders wait for the “unconditional probability” to drop (i.e., the time to tick away) while monitoring the live pressure indices.

If your pre-match model identifies a high-probability match for a first-half goal, you have two choices:
The danger of waiting is missing an early goal (the “early strike” risk). However, if you use the Predictology Live Value Bet Finder, you can see real-time data on shots, corners, and territory. If a match reaches the 20th minute at 0-0 but the live xG is tracking above the pre-match expectation, the “Over 0.5 FHG” market is almost certainly mispriced.
One of the biggest hurdles for serious punters is the time required to monitor dozens of matches simultaneously. This is why we emphasize the power of betting automation.
Once you have identified a profitable first-half system in our System Builder, you don’t have to place the bets manually. Predictology offers full integration with BF Bot Manager, allowing you to automate your strategies on the Betfair Exchange. You can set your bot to only enter the market at the 15th minute if the score is 0-0 and your specific xG criteria are met. This allows you to scale your betting across multiple leagues and time zones without being glued to a screen.
Profiting from first-half goals requires a shift in perspective. Instead of asking “who will win the match?”, you should be asking “how much pressure will be applied in the opening 30 minutes?”
To start building your own first-half model:
The first half isn’t just a prelude to the “real” game: it is a statistically dense period of play that offers some of the best value in the modern betting market.
October 17, 2026
How often do half-time leads hold? Win, draw and defeat rates for half-time leaders in 13 leagues so far in...
October 17, 2026
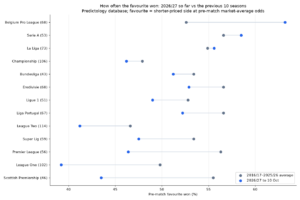
Favourites, draws and goals in 2026/27 so far compared with the previous 10 seasons across 13 leagues, from the Predictology...
October 17, 2026
In the world of football betting, 2026 marks a significant turning point. Just a few years ago, Expected Goals (xG)...
October 17, 2026
Expected Value (+EV) For the majority of football bettors, the live market is a whirlwind of emotion, reaction, and guesswork....
October 17, 2026
System Builder; for most football bettors, the journey starts with a gut feeling. You see a home team with a...
October 17, 2026
How often do half-time leads hold? Win, draw and defeat rates for half-time leaders in 13 leagues so far in...
October 17, 2026
Favourites, draws and goals in 2026/27 so far compared with the previous 10 seasons across 13 leagues, from the Predictology...
October 17, 2026
In the world of football betting, 2026 marks a significant turning point. Just a few years ago, Expected Goals (xG)...
October 17, 2026
Expected Value (+EV) For the majority of football bettors, the live market is a whirlwind of emotion, reaction, and guesswork....
October 17, 2026
System Builder; for most football bettors, the journey starts with a gut feeling. You see a home team with a...
Join the Discussion
We respect your privacy — your email won’t be shown. Fields marked * are required.