October 17, 2026
How Often Do Half-Time Leads Hold? 2026/27 vs the Last 10 Seasons
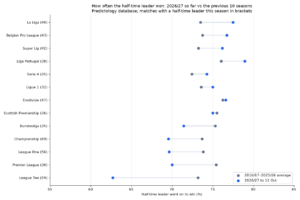
How often do half-time leads hold? Win, draw and defeat rates for half-time leaders in 13 leagues so far in...
System Builder; for most football bettors, the journey starts with a gut feeling. You see a home team with a strong record against bottom-half sides and decide they’re a “lock.” But in the world of professional betting, gut feelings are the fastest route to a depleted bankroll. To find a true competitive edge, you need to transition from subjective opinions to objective, data-driven strategies.
Update, 14 October 2026: Autobet, which sent Predictology picks to BF Bot Manager, stops on 17 October 2026. The Bot Manager and automated-betting steps in this article won’t work with Predictology after that. Everything else in Predictology works as before.
This is where the Predictology System Builder comes in. It is the core engine of our platform, designed to help you transform hypotheses into proven, profitable models. By leveraging a database of over 400,000 matches, you can test your ideas against history before risking a single penny of your capital.
In this guide, we’ll dive deep into the mechanics of the System Builder, the importance of statistical significance, and how to avoid the most common trap in betting: over-optimization.
The strength of any backtest is only as good as the data behind it. At Predictology, we provide access to one of the most comprehensive football databases available, covering hundreds of leagues worldwide. This historical depth allows you to see how a specific set of rules would have performed across different seasons, market conditions, and league tiers.
When you use the Predictology System Builder, you aren’t just looking at the last few weeks of results. You are analyzing thousands of data points to see if a trend is a genuine market inefficiency or just a temporary statistical fluke.
Building a system is about defining a logical set of rules that describe a specific betting scenario. Here is how to approach it within the platform:
The first step is selecting your “playground.” You can choose specific leagues (e.g., the English Premier League and Bundesliga) or broader categories like “Top European Leagues.” Limiting your scope is often better than “fishing” through every available league, as it keeps your model focused on markets where you have a better understanding of the dynamics.
What are you trying to predict? The System Builder supports all major markets, including Match Odds (1X2), Over/Under Goals, Both Teams to Score (BTTS), and Asian Handicaps. If you’re interested in specific goal-based strategies, you might want to read our guide on building a data-driven BTTS strategy.
Filters are the “brains” of your model. This is where you input your criteria. Common filters include:

Once you’ve set your rules, the System Builder runs those filters against the historical database. The result isn’t just a “win or loss” total; you get a comprehensive breakdown of technical metrics:
One of the biggest mistakes beginners make is getting excited about a strategy after 50 or 60 bets. In the world of probability, 50 bets is noise.
To have statistical confidence in a model, you should aim for a minimum of 200 to 500 bets in your backtest. Ideally, a robust system will show positive results over 1,000+ selections. The larger the sample size, the more likely the ROI reflects a genuine edge rather than a run of good luck.
As your sample size increases, you will often see your ROI “regress” to a more realistic level. This is normal. A 20% ROI over 50 bets is almost certainly luck; a 4% ROI over 1,500 bets is a professional-grade strategy. For more on this, check out our tips to improve your backtesting.

It is tempting to keep adding filters until your profit graph looks like a perfect diagonal line. This is known as over-optimization or “curve-fitting.”
If you tell the system to only bet on “Home teams, on a Tuesday, when the temperature is 14 degrees and the referee is wearing black,” you might find a set of matches that made a 50% profit. However, those rules have no logical footballing basis. You are simply finding patterns in random noise that will not repeat in the future.
To avoid over-fitting:
We’ve covered the pitfalls of over-optimization in detail in our article on 7 mistakes you’re making with overfitting.
The gold standard of backtesting is the In-Sample/Out-of-Sample split.
If the model performed well in the calibration period but loses money in the validation period, it was likely over-fit to the past. If it remains profitable across both, you have a high-probability winning system.

Once you have a backtested, validated model, the final step is execution. You can use your system to identify daily value bets or even automate your betting through tools like the BF Bot Manager.
Automating a proven system removes the emotional discipline required to place every bet manually, ensuring you never miss a +EV (Expected Value) opportunity.

The Predictology System Builder is more than just a tool; it’s a mindset shift. By spending the time to backtest your ideas against our 400k+ match database, you move away from the “gambler” archetype and toward the “analyst” role.
Your Practical Takeaway:
Start simple. Pick one market: like Over 2.5 Goals: and one league you know well. Use the System Builder to test a basic logic (e.g., high-scoring teams playing away against poor defenses). Aim for a sample size of at least 300 bets and focus on stability over seasons rather than a massive short-term ROI.
Ready to start building? Explore our pricing plans and join a community of bettors who let the data lead the way.
October 17, 2026
How often do half-time leads hold? Win, draw and defeat rates for half-time leaders in 13 leagues so far in...
October 17, 2026
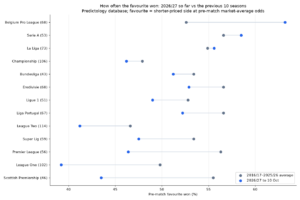
Favourites, draws and goals in 2026/27 so far compared with the previous 10 seasons across 13 leagues, from the Predictology...
October 17, 2026
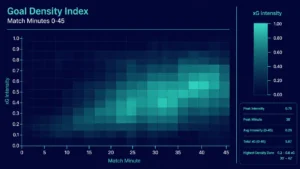
Expected Goals (xG); many recreational bettors spend their Saturday afternoons fixated on the final whistle. They track full-time results, late...
October 17, 2026
In the world of football betting, 2026 marks a significant turning point. Just a few years ago, Expected Goals (xG)...
October 17, 2026
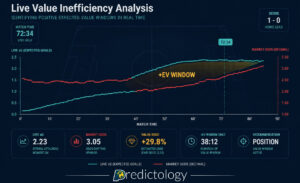
Expected Value (+EV) For the majority of football bettors, the live market is a whirlwind of emotion, reaction, and guesswork....
October 17, 2026
How often do half-time leads hold? Win, draw and defeat rates for half-time leaders in 13 leagues so far in...
October 17, 2026
Favourites, draws and goals in 2026/27 so far compared with the previous 10 seasons across 13 leagues, from the Predictology...
October 17, 2026
Expected Goals (xG); many recreational bettors spend their Saturday afternoons fixated on the final whistle. They track full-time results, late...
October 17, 2026
In the world of football betting, 2026 marks a significant turning point. Just a few years ago, Expected Goals (xG)...
October 17, 2026
Expected Value (+EV) For the majority of football bettors, the live market is a whirlwind of emotion, reaction, and guesswork....
Join the Discussion
We respect your privacy — your email won’t be shown. Fields marked * are required.