July 17, 2026
Beyond the Full-Time Result: Profiting from 1st Half Goals and xG Trends
Expected Goals (xG); many recreational bettors spend their Saturday afternoons fixated on the final whistle. They track full-time results, late...
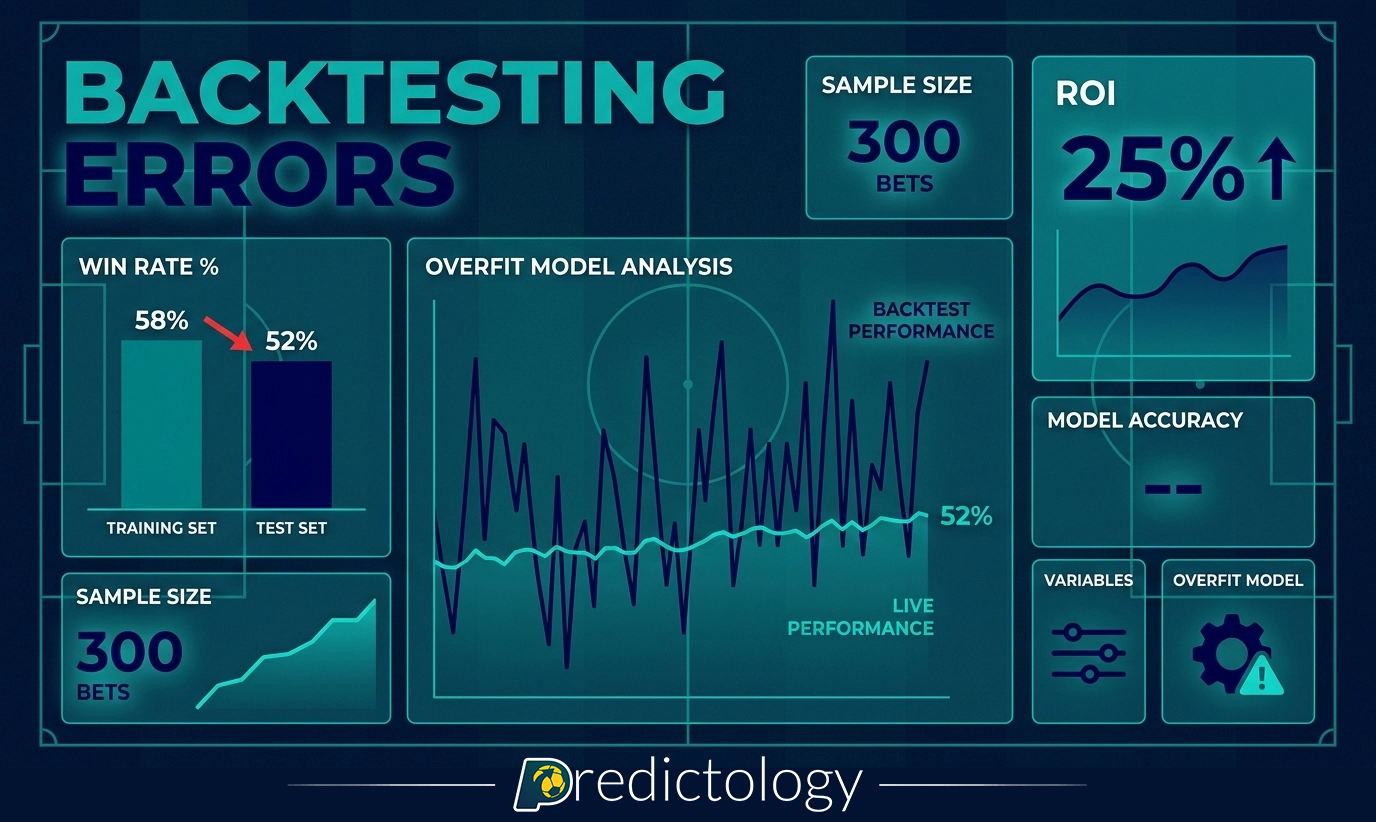
Backtesting; every bettor has been there. You spend hours in a database, tweaking variables and adding filters, until suddenly: boom. You’ve found it. A system that shows a 25% ROI over the last three seasons. The profit graph is a beautiful, upward-sloping line that looks like a stairway to heaven. You feel like you’ve cracked the code.
But three weeks into live betting, the “perfect” system is already 15 units down. You double-check the logic, but the results just aren’t matching the history. This is the backtesting illusion, and it is the primary reason why most data-driven bettors fail.
Backtesting is the process of simulating a strategy using historical data to see how it would have performed. While it is an essential part of developing a winning edge, it is also a minefield of cognitive biases and statistical errors. If you aren’t careful, your backtest won’t show you a winning strategy; it will simply show you a “random coincidence” that happened in the past.
In this guide, we will break down the most common mistakes bettors make when validating their football systems and how to use the Predictology System Builder to build models that actually hold up under the pressure of live markets.
Overfitting is the single most common mistake in sports modeling. In technical terms, it occurs when a model is so complex that it begins to “memorize” the noise in the historical data rather than identifying the underlying signal.
Imagine you are looking at home wins in the Premier League. You notice that your system performs better when it rains. Then you notice it performs even better when the away team’s striker is under 6 feet tall. If you add these as filters, your historical ROI goes up. But does the height of a striker actually have a causal relationship with the result, or did you just find a random cluster of data points that favored your model?
Many bettors believe that the more filters they add, the more “accurate” their system becomes. In reality, the opposite is often true. Every time you add a filter: such as “only bet on Sundays” or “only when the temperature is below 10°C”: you are shrinking your sample size and increasing the risk of p-hacking.
P-hacking is the practice of testing so many variables that something is bound to look statistically significant just by pure chance. If you test 100 random variables, five of them will likely show a “significant” result with 95% confidence, even if they have zero predictive power.

Before you add a filter to your system in the Predictology platform, ask yourself: Does this make sense?
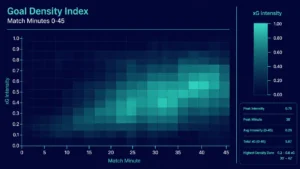
If you are filtering for high-scoring games, using metrics like xG (Expected Goals) regression makes logical sense. xG measures the quality of chances created, which is a strong lead indicator of future performance. However, filtering for specific days of the week or specific referees often lacks a logical foundation and is usually just noise.
Rule of thumb: Keep your models as simple as possible. A model with three strong, logical variables will almost always outperform a model with twelve “optimized” variables in the long run.
The human brain is naturally bad at understanding randomness. We tend to see patterns where none exist: a phenomenon known as the Law of Small Numbers.
In football betting, many people get excited after a run of 40 or 50 bets. They see a 15% ROI and assume they have a massive edge. However, in a sport with as much variance as football, a 50-bet sample is practically meaningless. Even a coin flipper can have a “profitable” run over 50 flips.
Football is a low-scoring sport where a single red card, a deflected shot, or a missed penalty can completely change the outcome of a match. This inherent “noise” means that short-term results are heavily influenced by luck.
To determine if your edge is real, you need to look at your performance over a statistically significant number of bets.
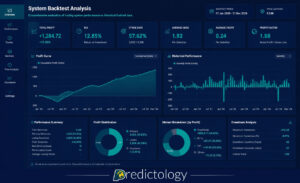
While there is no “magic number,” most professional analysts look for at least 250 to 500 bets before they begin to trust the results of a backtest. Even then, they remain cautious.

At Predictology, our System Builder allows you to analyze over 400,000 historical matches. This massive database ensures you aren’t just looking at a lucky streak from last month. You can test your strategy over multiple seasons, across different leagues, and through various market cycles. If a system only works in the English Championship but fails in every other European league, it’s likely a fluke rather than a robust strategy.
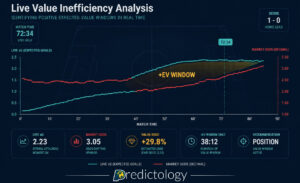
A common mistake in backtesting is failing to account for the “price” you are getting. If your backtest assumes you are getting odds of 2.00, but by the time you go to place the bet the market has moved to 1.85, your “edge” has likely vanished.
The most accurate representation of a team’s true probability is the Closing Price (the odds just before kick-off). If your system consistently identifies bets at odds higher than the eventual closing price, you have found “Closing Line Value” (CLV). CLV is the most reliable indicator of long-term profitability.
When using our +EV Strategy Builder, we track over 20,000 bets to identify where the value actually sits. If your backtest doesn’t account for market movement or the impact of commission (on exchanges like Betfair), you are setting yourself up for a nasty surprise when you start trading with real money.
How do you avoid these pitfalls? At Predictology, we have designed our tools to help you move from “guessing” to “validating.”

One of the best ways to validate a model is Out-of-Sample testing. This involves splitting your data into two sets:
If the system performs well in the Training Set but collapses in the Test Set, you have overfitted. If the performance is consistent across both, you are on to something. Our System Builder makes this process seamless, allowing you to instantly see how a strategy would have fared across different timeframes.
Instead of starting from scratch, many of our members use the +EV Strategy Builder to find existing high-value opportunities. These strategies are already tracked and vetted, providing a baseline for your own development. You can see the drawdowns, the win rates, and the historical volatility before you ever risk a penny.
To become a professional-level bettor, you must treat your systems like a business. This means following a strict validation process:

Backtesting is a powerful tool, but it is only as good as the person using it. Avoid the temptation to “perfect” your historical results through endless filtering. Focus on large sample sizes, logical foundations, and out-of-sample validation.
If you are ready to stop guessing and start building data-driven systems that actually work, head over to our LaunchPad educational resources or dive straight into the System Builder today. The data is there( you just need the right process to unlock it.)
July 17, 2026
Expected Goals (xG); many recreational bettors spend their Saturday afternoons fixated on the final whistle. They track full-time results, late...
July 17, 2026
In the world of football betting, 2026 marks a significant turning point. Just a few years ago, Expected Goals (xG)...
July 17, 2026
Expected Value (+EV) For the majority of football bettors, the live market is a whirlwind of emotion, reaction, and guesswork....
July 17, 2026
System Builder; for most football bettors, the journey starts with a gut feeling. You see a home team with a...
July 17, 2026
Analytics; to move from a casual punter to a professional bettor, you must transition from making “picks” to executing a...
July 17, 2026
Expected Goals (xG); many recreational bettors spend their Saturday afternoons fixated on the final whistle. They track full-time results, late...
July 17, 2026
In the world of football betting, 2026 marks a significant turning point. Just a few years ago, Expected Goals (xG)...
July 17, 2026
Expected Value (+EV) For the majority of football bettors, the live market is a whirlwind of emotion, reaction, and guesswork....
July 17, 2026
System Builder; for most football bettors, the journey starts with a gut feeling. You see a home team with a...
July 17, 2026
Analytics; to move from a casual punter to a professional bettor, you must transition from making “picks” to executing a...


Join the Discussion
We respect your privacy — your email won’t be shown. Fields marked * are required.