
May 20, 2026
Stop Wasting Time on Manual Live Betting: Try These 7 Automation Hacks
Automation; most football bettors start their journey with a manual approach: watching a match, checking some stats on a phone,...
Most football bettors are now familiar with Expected Goals (xG). It has become the gold standard for evaluating team performance, moving us away from the era of simply looking at “shots on target.” However, if you are relying solely on xG to inform your live trading or in-play betting, you are likely reacting to events rather than anticipating them.
The problem with xG is that it is a lagging indicator. It only records data at the moment a shot is taken. If a team spends ten minutes pinned in the opposition’s penalty area but fails to get a shot away due to a last-ditch block or a heavy touch, their xG remains 0.00. Yet, anyone watching the match knows a goal is “coming.”
At Predictology, we look for the data that exists between the shots. To truly spot a goal before it happens, you need to understand the relationship between Expected Goals (xG) and its more predictive siblings: Expected Threat (xT) and Expected Shots (xS).
To understand why xG can sometimes mislead live traders, we have to look at its anatomy. xG measures the probability of a shot resulting in a goal based on historical data. It takes into account the distance from the goal, the angle of the shot, the type of assist, and defensive pressure.
When a player takes a shot, the xG model assigns a value between 0 and 1. A penalty is typically 0.76 xG (a 76% chance of scoring), while a speculative long-range effort might be 0.02 xG.
The fundamental limitation is that xG requires a shot to exist. In the world of professional betting, the market is incredibly efficient at reacting to shots. The moment a high-quality shot is taken, the odds for “Next Goal” or “Over 2.5 Goals” shorten instantly. If you wait for the xG to spike on your dashboard, you have already missed the “Value Window.”
To gain a real competitive edge, we need to identify scoring momentum while the odds are still high: before the shot is even taken. This is where xT and xS come into play.
While xG looks at the end of an attacking sequence, Expected Threat (xT) and Expected Shots (xS) look at the process. They measure how effectively a team is moving the ball into dangerous areas and how much pressure they are exerting on the opposition defense.

Expected Threat (xT) is a metric that divides the pitch into a grid. Each square on that grid is assigned a value based on how likely a goal is to be scored from that position within the next few actions.
When a player moves the ball from a low-value zone (like the halfway line) into a high-value zone (like the “Zone 14” just outside the box), they generate positive xT.
Expected Shots (xS) is often used to predict the frequency of shooting opportunities based on field tilt and possession quality. While xG tells you how good the shots were, xS tells you how many shots a team should be generating given their dominance.
When you see a significant divergence between a team’s xS (high) and their actual shots taken (low), you are looking at a bottleneck. History tells us that in professional football, these bottlenecks eventually break. The “Pressure Index” begins to redline, and a flurry of xG events (shots) usually follows.
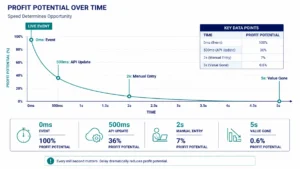
The secret to spotting a goal before it happens lies in identifying the Pressure Gap. This is the period of time where a team’s xT and attacking intensity are rising sharply, but their xG remains flat because they haven’t found the final pass yet.

In the chart above, you can see the Teal line (Attack Intensity/xT) climbing steadily. During this phase, the market often remains stagnant because no “official” shots have been registered. However, the probability of a goal is increasing with every successful entry into the box.
As a data-driven bettor, this is your entry point. By the time the Navy line (xG) spikes, the goal has often already been scored, or the odds have collapsed. By monitoring the “Value Index” of the momentum build-up, you can secure positions at +EV (Positive Expected Value) before the rest of the market catches on.
Why the market lags:
You don’t need to be a data scientist to use these concepts. We have built these advanced analytics directly into our platform.
For instance, our Live Value Bet Finder scans over 50 global leagues in real-time. It doesn’t just look at the current score; it compares the live market odds against our proprietary statistical models that account for these momentum shifts.
If our model sees a team with a high “Fair Price” for a goal based on their underlying xT and pressure metrics, but the bookmaker is still offering high odds because no shots have been taken, the Live Value Bet Finder will flag it as a +EV opportunity.
Furthermore, our xG live trading tools allow you to visualize these trends as they happen. Instead of guessing if a team is “playing well,” you can see the numerical evidence of their dominance. When the Pressure Index hits a certain threshold, our members are alerted to potential in-play opportunities, allowing for a professional, clinical approach to live trading.
Let’s look at a typical scenario where xS vs xG provides a winning edge. Imagine a match between a heavy favorite and a defensive underdog.
By the 30th minute, the score is 0-0.

The bar chart above illustrates this exact scenario. The Teal bars (Threat Generation) are through the roof, but the Navy bars (Actual Shots) are lagging. The market looks at the 0-0 scoreline and the low shot count and keeps the “Over 0.5 First Half Goals” at a high price.
However, the Expected Shot Volatility is high. The favorite is pinning the underdog back. Statistically, the “Pressure Gap” is about to close. A trader using Predictology sees this divergence and enters a “Back Over 0.5” or “Back the Favorite” position.
Five minutes later, the pressure results in a blocked shot, a corner, and then a tap-in. The xG suddenly spikes to 0.95, the goal is scored, and the trade is successful. The key was entering based on the threat (xT), not waiting for the shot (xG).
To move from a casual punter to a professional bettor, you must stop chasing outcomes and start chasing processes.
Goals are the result of sustained pressure and high-quality ball progression. While xG is a fantastic tool for post-match analysis and long-term modeling, xT and xS are the kings of live trading.
Your next steps:
The “trick” isn’t magic: it’s simply looking at the data that the rest of the market is ignoring. Focus on the threat, and the goals will take care of themselves.
May 20, 2026
Automation; most football bettors start their journey with a manual approach: watching a match, checking some stats on a phone,...
May 20, 2026
If you have spent any time on a sportsbook app lately, you have probably been bombarded with “Bet Builders” or...
May 20, 2026
Overfitting; the dream of every data-driven bettor is a “perfect” system. We open a tool like the Predictology Strategy Builder,...
May 20, 2026
Latency; in the world of high-stakes football betting, being “right” is only half the battle. You can have the most...
May 20, 2026
Easy Edges; in the sports betting world of 2026, the term “easy money” feels like a relic of a distant...
May 20, 2026
Automation; most football bettors start their journey with a manual approach: watching a match, checking some stats on a phone,...
May 20, 2026
If you have spent any time on a sportsbook app lately, you have probably been bombarded with “Bet Builders” or...
May 20, 2026
Overfitting; the dream of every data-driven bettor is a “perfect” system. We open a tool like the Predictology Strategy Builder,...
May 20, 2026
Latency; in the world of high-stakes football betting, being “right” is only half the battle. You can have the most...
May 20, 2026
Easy Edges; in the sports betting world of 2026, the term “easy money” feels like a relic of a distant...


Join the Discussion
We respect your privacy — your email won’t be shown. Fields marked * are required.