
July 17, 2026
Beyond the Full-Time Result: Profiting from 1st Half Goals and xG Trends
Expected Goals (xG); many recreational bettors spend their Saturday afternoons fixated on the final whistle. They track full-time results, late...
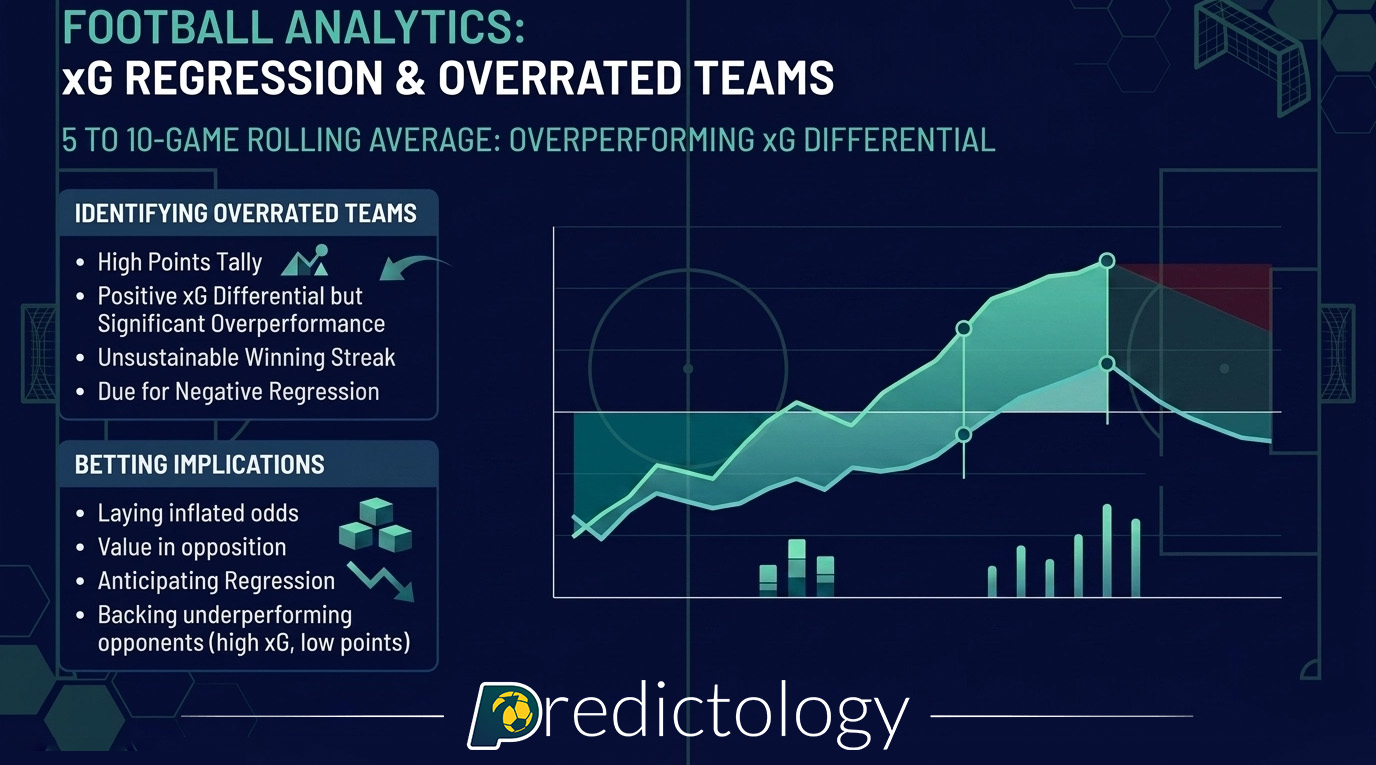
xG Regression; scorelines tell you what happened. They do not always tell you how it happened. A team can win 3-0 while creating only 1.1 xG. Another can draw 1-1 after generating 2.0 xG and conceding very little. If you only read the final score, both performances can look misleading. That is where xG regression becomes useful.
Expected Goals (xG) helps measure chance quality rather than just outcomes. Over time, teams that consistently score far above their xG, or concede far fewer than expected, often move back toward more normal levels. That process is regression. It does not mean the team is bad. It means the market can overrate recent results when those results were boosted by finishing streaks, low-probability goals, or short-term variance.
For bettors, this matters because markets often react faster to results than to underlying process. A team on a 4-game winning run can become overpriced if those wins were built on thin chance creation and unsustainably clinical finishing. In the same way, a team with poor recent scorelines can offer value if their xG numbers remain strong.

xG regression is not about calling every winning team lucky. It is about separating sustainable performance from short-term noise.
If a team has scored 18 goals from chances worth 11.5 xG across the last 10 matches, that gap matters. Some teams do finish slightly above expectation because of player quality. But large gaps over short samples are often unstable. When the market prices that team as if the scoring rate will continue unchanged, value can shift to the other side.
A useful way to assess this is through rolling sample windows. Looking at the last 5 to 10 matches helps you see whether a team is improving structurally or simply riding hot finishing. If chance creation, shot quality, and defensive control are flat while results keep improving, that is often a warning sign rather than a confirmation signal.
Focus on three things:
A team that keeps winning despite losing the xG battle is often getting more credit from the market than the process deserves.

Are scorelines dead? No. They still decide who gets the three points. But for the serious bettor, the scoreline is merely a distraction: a shiny object that draws the attention of the masses while the real value remains hidden in the underlying data.
By mastering xG regression, you stop being a gambler who hopes for a result and start being an analyst who expects a trend. Whether you are a beginner looking to understand the game better or a pro looking to automate a new strategy, understanding the “why” behind the “what” is the only way to achieve long-term profitability.
Ready to see the data behind the scores? Head over to the Predictology LaunchPad and start building your own xG-based models today. The market might be fooled by a lucky scoreline, but with the right tools, you won’t be.
Practical Next Step: Go to the Predictology System Builder and run a search for teams in the Premier League or Bundesliga that have scored at least 5 goals more than their xG over the last 10 games. Monitor their results for the next month. You’ll be surprised how often the “inevitable” regression arrives exactly on schedule.
July 17, 2026
Expected Goals (xG); many recreational bettors spend their Saturday afternoons fixated on the final whistle. They track full-time results, late...
July 17, 2026
In the world of football betting, 2026 marks a significant turning point. Just a few years ago, Expected Goals (xG)...
July 17, 2026
Expected Value (+EV) For the majority of football bettors, the live market is a whirlwind of emotion, reaction, and guesswork....
July 17, 2026
System Builder; for most football bettors, the journey starts with a gut feeling. You see a home team with a...
July 17, 2026
Analytics; to move from a casual punter to a professional bettor, you must transition from making “picks” to executing a...
July 17, 2026
Expected Goals (xG); many recreational bettors spend their Saturday afternoons fixated on the final whistle. They track full-time results, late...
July 17, 2026
In the world of football betting, 2026 marks a significant turning point. Just a few years ago, Expected Goals (xG)...
July 17, 2026
Expected Value (+EV) For the majority of football bettors, the live market is a whirlwind of emotion, reaction, and guesswork....
July 17, 2026
System Builder; for most football bettors, the journey starts with a gut feeling. You see a home team with a...
July 17, 2026
Analytics; to move from a casual punter to a professional bettor, you must transition from making “picks” to executing a...


Join the Discussion
We respect your privacy — your email won’t be shown. Fields marked * are required.