July 17, 2026
Beyond the Full-Time Result: Profiting from 1st Half Goals and xG Trends
Expected Goals (xG); many recreational bettors spend their Saturday afternoons fixated on the final whistle. They track full-time results, late...
If you have spent any time watching a post-match analysis or scrolling through football Twitter lately, you have undoubtedly seen the term xG (Expected Goals). To the casual observer, it looks like just another “nerd stat” designed to overcomplicate a simple game. But for the serious bettor, xG is perhaps the most revolutionary tool in the modern sports analytics arsenal.
The problem? Most people use it wrong. They see a team win 1-0 despite an xG of 0.85 vs 2.10 and assume the stat is “broken.” In reality, that scoreline is exactly why xG exists. It tells you what should have happened based on the quality of chances, not just what did happen.
In the next three minutes, we are going to strip away the jargon and show you exactly how xG works and, more importantly, how you can use it to find an edge in the markets using Predictology.
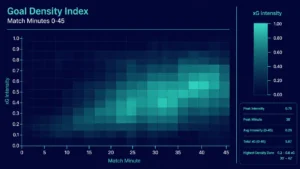
At its core, Expected Goals (xG) is a statistical measure of the quality of a goal-scoring chance. It assigns a numerical value: between 0.00 and 1.00: to every shot taken in a match. This value represents the probability that the shot will result in a goal.
For example, a penalty has an xG value of roughly 0.76. This means that, historically, 76% of all penalties taken in professional football result in a goal. A speculative long-range effort from 35 yards out might have an xG of 0.02, meaning only 2% of those shots actually find the back of the net.
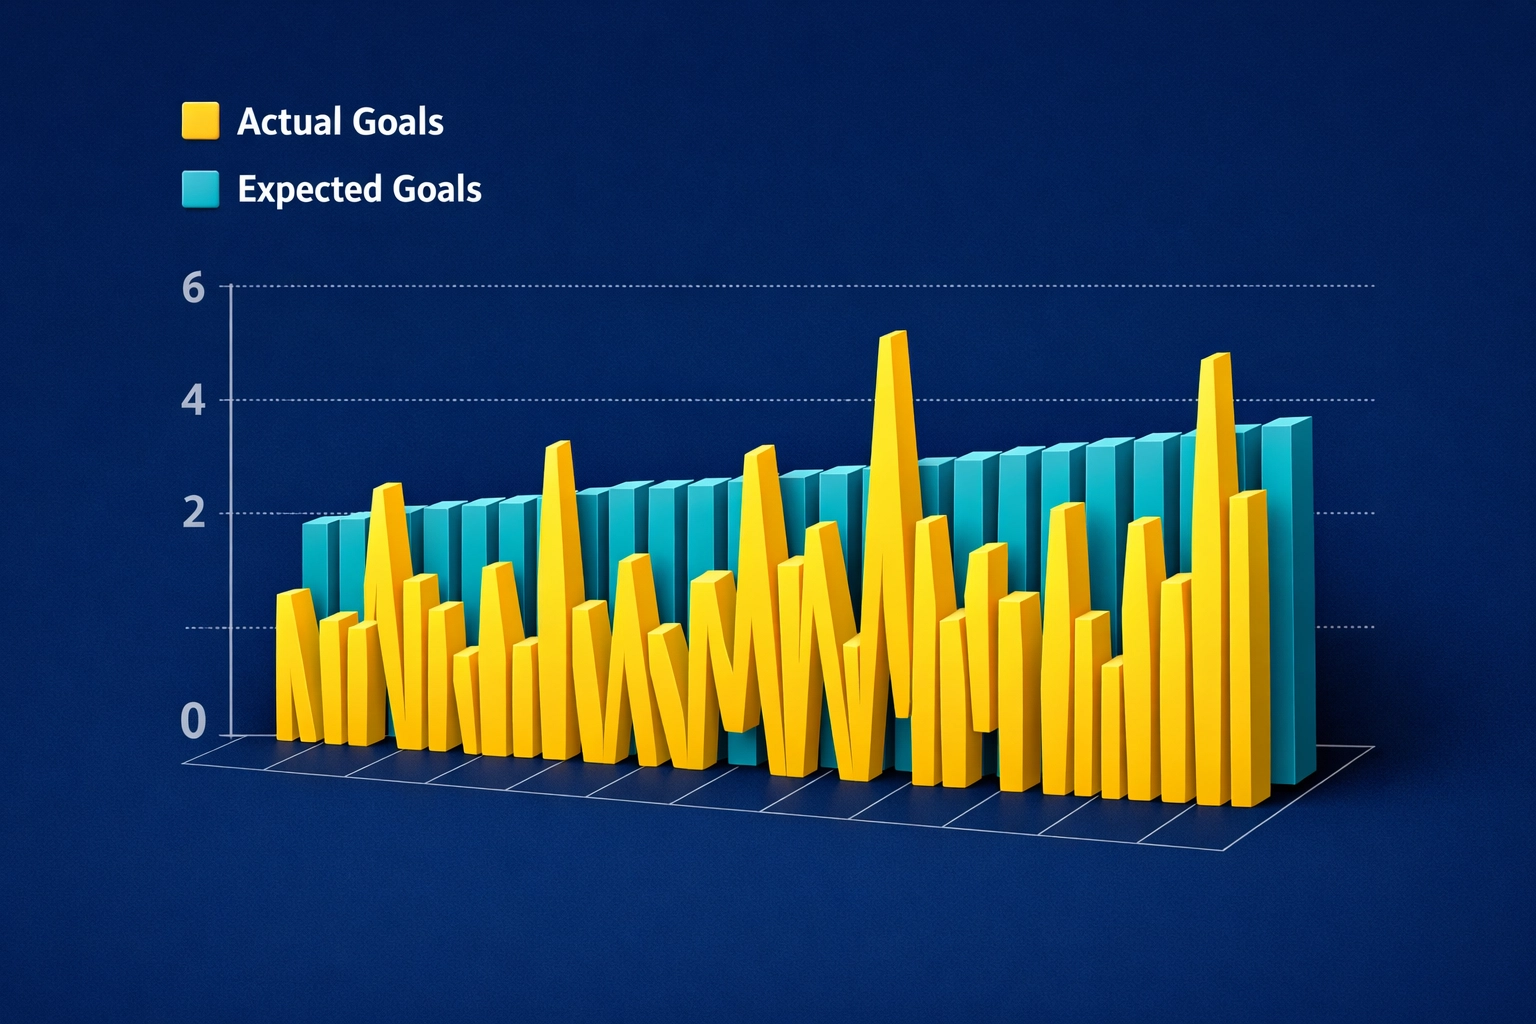
In betting, we often fall into the trap of “results bias.” We look at a team that has won three games in a row and assume they are in “great form.” But what if those three wins were all 1-0 victories where the winning goal was a lucky deflection, and the opposition missed three open goals?
Goals are rare events. Because they happen so infrequently, they are prone to high levels of variance (luck). xG filters out that noise. It focuses on the process rather than the outcome. By looking at the quality of chances a team creates and concedes, we get a much clearer picture of their true underlying performance level.
You don’t need a degree in data science to use xG, but it helps to understand what goes into the “black box” of the model. When an xG model evaluates a shot, it looks at several key variables:
This is the most significant factor. The closer a player is to the goal, the higher the xG. A tap-in from three yards is significantly more valuable than a shot from the edge of the box.
A shot taken directly in front of the goal has a much higher probability of scoring than one taken from a tight, acute angle near the touchline.
Was the shot preceded by a cross, a through ball, or a rebound? A high-speed cross is harder to convert than a square pass across the face of the goal.
Was it a header? Was it a one-on-one with the keeper? Was the player under intense pressure from a defender? Advanced models, like those we integrate into our Predictology analysis, take these nuances into account to provide a highly accurate probability.
One of the biggest critiques of xG is that it doesn’t account for the player taking the shot. An xG model treats a shot from Erling Haaland the same way it treats a shot from a League Two center-back, provided the positioning is the same.
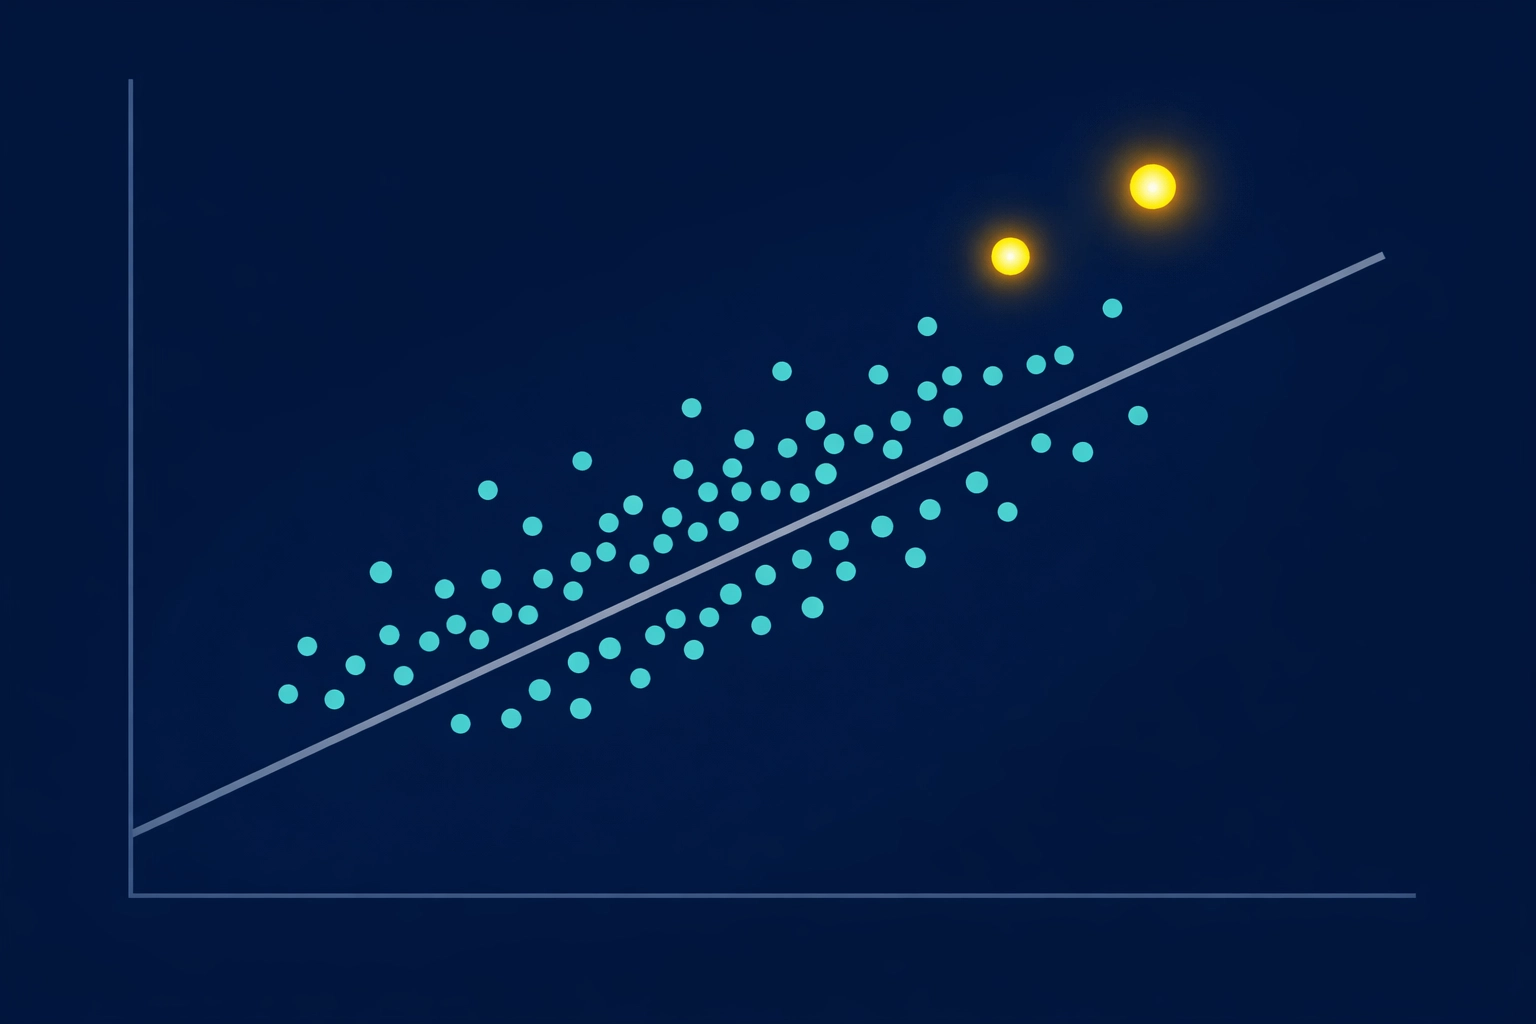
This is where “Elite Finishers” come in. Players like Son Heung-min or Lionel Messi consistently outscore their xG. For instance, in the 2021/22 season, Son scored 23 goals from just 13.95 xG. Does this mean the stat is wrong? No. It means Son is an outlier with elite finishing ability.
For bettors, this is vital information. If you see a team with average strikers significantly outperforming their xG, they are likely riding a wave of luck that will eventually crash. This is called regression to the mean. Betting against teams that are unsustainably over-performing their xG is a cornerstone of a smart +EV Strategy.

So, how do we turn these numbers into profit? At Predictology, we focus on finding the disconnect between the “public perception” (the scoreline) and the “statistical reality” (the xG).
If a team is consistently generating 2.00 xG per match but only scoring 0.5 goals, the market will likely undervalue them in their next fixture. The odds will reflect their poor scoring record, but the data suggests that if they keep creating those same high-quality chances, the goals will come.
You can use the Predictology System Builder to filter for teams that have a high xG-to-goal deficit over their last five matches. This is often where the best “Buy Low” opportunities reside.
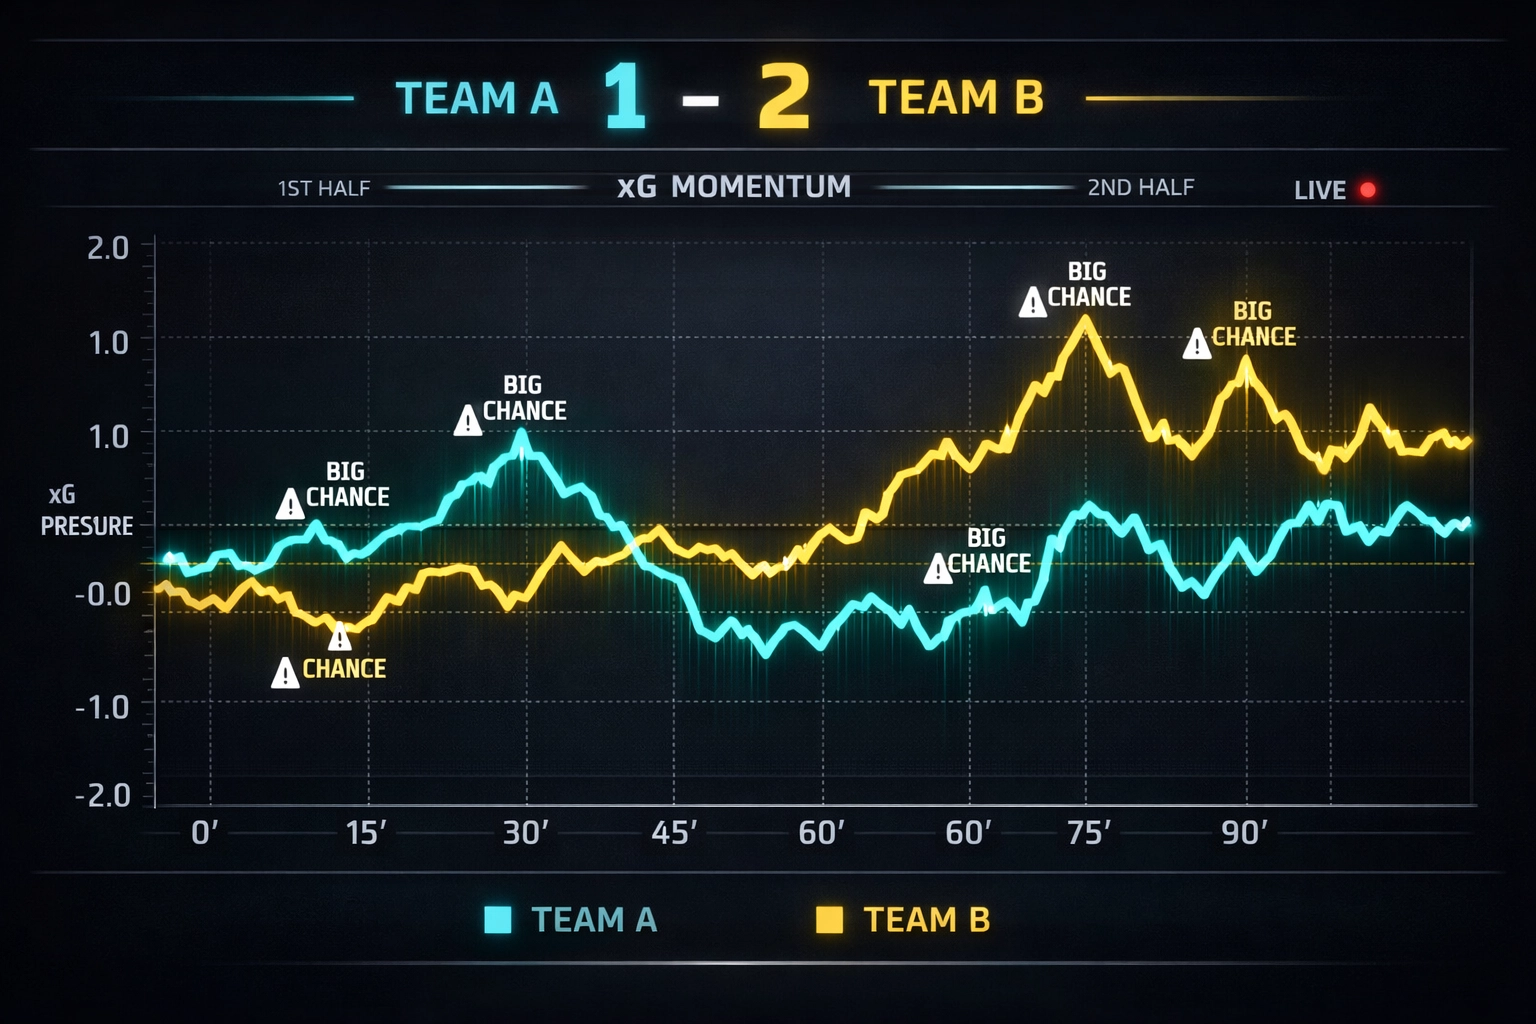
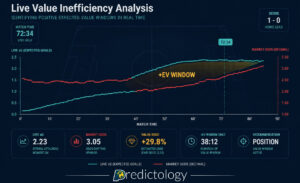
xG isn’t just for pre-match analysis. During a live game, xG is a powerhouse metric. If a favorite is down 1-0 at halftime, but the xG is 1.80 to 0.10 in their favor, the “Live Value” is clearly on the trailing team to comeback or at least score the next goal.
Our Live Value Bet Finder tracks these shifts in real-time, allowing you to jump on prices before the bookmaker’s algorithm fully adjusts to the dominance shown on the pitch.
To be a professional bettor, you must understand the weaknesses of your tools. xG is not a magic wand. Here are a few things it doesn’t capture perfectly:
This is why we recommend using xG as a primary filter in your +EV Strategy Builder, but combining it with other metrics like possession in the final third and big chances created.
If you are ready to stop betting on “gut feeling” and start betting on data, here is your roadmap:
The next time you see a “shock” result, don’t just look at the score. Check the xG. If the underdog won with an xG of 0.20 while conceding 2.50, don’t assume they’ve “found a formula.” Assume they got lucky. In the long run, the team creating the 2.50 xG will win you more money.
Ready to dive deeper? Explore our Insights & Tutorials to see how we integrate advanced analytics into winning betting systems every day.
Stop chasing goals. Start chasing xG. It’s the closest thing to a crystal ball we have in the world of football analytics. By focusing on the quality of chances, you are no longer gambling; you are investing in probability.
Check out our Pricing page to get full access to the data tools used by the pros.
July 17, 2026
Expected Goals (xG); many recreational bettors spend their Saturday afternoons fixated on the final whistle. They track full-time results, late...
July 17, 2026
In the world of football betting, 2026 marks a significant turning point. Just a few years ago, Expected Goals (xG)...
July 17, 2026
Expected Value (+EV) For the majority of football bettors, the live market is a whirlwind of emotion, reaction, and guesswork....
July 17, 2026
System Builder; for most football bettors, the journey starts with a gut feeling. You see a home team with a...
July 17, 2026
Analytics; to move from a casual punter to a professional bettor, you must transition from making “picks” to executing a...
July 17, 2026
Expected Goals (xG); many recreational bettors spend their Saturday afternoons fixated on the final whistle. They track full-time results, late...
July 17, 2026
In the world of football betting, 2026 marks a significant turning point. Just a few years ago, Expected Goals (xG)...
July 17, 2026
Expected Value (+EV) For the majority of football bettors, the live market is a whirlwind of emotion, reaction, and guesswork....
July 17, 2026
System Builder; for most football bettors, the journey starts with a gut feeling. You see a home team with a...
July 17, 2026
Analytics; to move from a casual punter to a professional bettor, you must transition from making “picks” to executing a...


Join the Discussion
We respect your privacy — your email won’t be shown. Fields marked * are required.