July 26, 2026
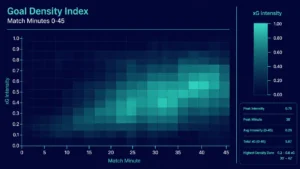
Beyond the Full-Time Result: Profiting from 1st Half Goals and xG Trends
Expected Goals (xG); many recreational bettors spend their Saturday afternoons fixated on the final whistle. They track full-time results, late...
Form-Based xG; in the world of football betting, the quest for the “perfect” metric is unending. For years, savvy punters relied on league averages to determine value. If a league averaged 2.8 goals per game and two high-scoring teams were meeting, the “Over 2.5” market seemed like a mathematical certainty. But as the markets have become more efficient, these static benchmarks are losing their edge.
The reality of modern football is that static season-long averages often mask the most profitable opportunities. A team might be averaging 1.5 xG (Expected Goals) across the season, but that figure is a composite of their peak performance under a former manager, a mid-season injury crisis, and their current tactical resurgence. By the time you bet on the “average,” the market has already moved on.
To stay ahead, professional bettors are shifting their focus from broad league data to granular, form-based xG analysis. This approach prioritizes what a team is doing now over what they did six months ago, allowing you to identify market inefficiencies before the bookmakers’ models fully adjust to the new reality.

Many bettors fall into the trap of “stat squashing.” This happens when you take twenty or thirty games of data and compress them into a single number. While this gives you a sense of a team’s general quality, it ignores the dynamic nature of a football season.
When you use a season average, you are essentially treating a game in August with the same weight as a game in April. This is a fundamental flaw in predictive modeling. A team’s xG output is not a fixed trait; it is a variable heavily influenced by external factors such as player fitness, confidence, and tactical adjustments.
Imagine a team that started the season poorly, creating only 0.80 xG per game over their first ten matches. In their next ten matches, they sign a creative midfielder and their output jumps to 1.80 xG. Their season average would sit at a mediocre 1.30 xG. If you bet based on that 1.30 figure, you are drastically underestimating their current scoring potential. The market, often influenced by long-term data, might price them as a mid-table side, while their current form suggests they are playing like title contenders.
Form-based xG: specifically using rolling 10-game or 15-game windows: is the most effective way to filter out “noise” and focus on “signal.” Research suggests that the most predictive window for future performance is roughly the last 10 matches. This is the “sweet spot” where you have enough data to be statistically significant, but not so much that you’re looking at irrelevant history.
By focusing on a team’s rolling xG difference, you can see the exact moment a team begins to overperform or underperform their baseline. This is where the real value lies.

At Predictology, our System Builder allows you to filter matches based on recent form, helping you to identify these shifts. For instance, a team might have a high season-long xG but a declining rolling xG. This “hidden decline” is a perfect opportunity to bet against the public perception of that team.
One of the biggest reasons league averages fail is the “structural break.” This is a point in the season where the fundamental conditions of a team change.
When a new manager arrives, they often bring a completely different tactical philosophy. A defensive-minded coach might be replaced by one who favors a high-press, attacking style. In this scenario, historical xG data before the manager change is virtually useless.
A famous example is Manchester United’s transition under various managers. A season-long average would have suggested a steady, mid-tier xG performance, but the reality was a series of sharp peaks and troughs as tactics shifted. Punters who tracked the rolling xG during the first five games of a new tenure were able to capitalize on bookmakers who were still using season-long models.

Similarly, the loss of a key creative player: like a Kevin De Bruyne or a Martin Ødegaard: can cause a team’s xG to crater overnight. A model based on league averages will take weeks to reflect this decline. However, a form-based model that weights recent games more heavily will flag the drop-off immediately, allowing you to find value in the “Under” markets or by betting on the opposition.
Moving from casual betting to professional trading requires the right tools. You can’t manually calculate 10-game rolling xG averages for every team in the top European leagues: not if you want to have a life outside of spreadsheets.
This is why we built the xG Live Trading Tools and the System Builder. These tools do the heavy lifting for you, allowing you to:
Statisticians often note that by the 16th match of a season, xG and actual goals start to align more closely. While this makes season-long tables more “accurate,” it also makes the market more efficient. The most profitable window for form-based betting is usually between matches 6 and 15, where the “new form” hasn’t yet been fully baked into the season-long stats that most casual bettors use.

If you want to treat betting as an investment, you must stop relying on stagnant data. League average stats are a useful starting point, but they are a rearview mirror approach to a forward-looking market.
By adopting form-based xG analysis, you acknowledge that football is a dynamic, ever-changing sport. You start to see the “why” behind the numbers: the tactical shifts, the player impact, and the genuine momentum that season averages ignore.
Your Practical Takeaway:
Next time you are analyzing a match, don’t just look at the league table or the “Goals per Game” for the season. Instead, look at the last 5 and last 10 games specifically. If there is a discrepancy of 0.5 xG or more between the season average and the 5-game rolling average, you’ve likely found a market inefficiency worth investigating.
Ready to stop guessing and start using professional-grade data? Explore how our System Builder can help you build your own form-based models today.
July 26, 2026
Expected Goals (xG); many recreational bettors spend their Saturday afternoons fixated on the final whistle. They track full-time results, late...
July 26, 2026
In the world of football betting, 2026 marks a significant turning point. Just a few years ago, Expected Goals (xG)...
July 26, 2026
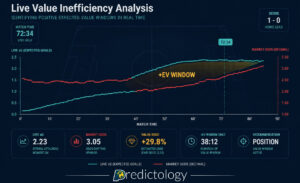
Expected Value (+EV) For the majority of football bettors, the live market is a whirlwind of emotion, reaction, and guesswork....
July 26, 2026
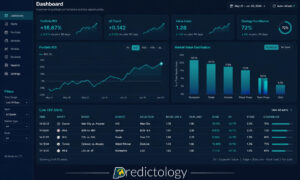
System Builder; for most football bettors, the journey starts with a gut feeling. You see a home team with a...
July 26, 2026
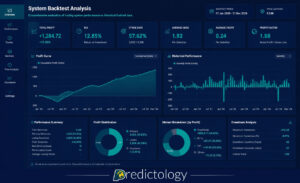
Analytics; to move from a casual punter to a professional bettor, you must transition from making “picks” to executing a...
July 26, 2026
Expected Goals (xG); many recreational bettors spend their Saturday afternoons fixated on the final whistle. They track full-time results, late...
July 26, 2026
In the world of football betting, 2026 marks a significant turning point. Just a few years ago, Expected Goals (xG)...
July 26, 2026
Expected Value (+EV) For the majority of football bettors, the live market is a whirlwind of emotion, reaction, and guesswork....
July 26, 2026
System Builder; for most football bettors, the journey starts with a gut feeling. You see a home team with a...
July 26, 2026
Analytics; to move from a casual punter to a professional bettor, you must transition from making “picks” to executing a...

Join the Discussion
We respect your privacy — your email won’t be shown. Fields marked * are required.