Football AnalysisFootball bettingin-play football bettingxG Expected Goals
April 28, 2026
7-min read
Expected Goals; in the world of professional football trading, data is the only currency that truly matters. While casual punters are chasing “gut feelings” or reacting to a single goal, professional traders are looking at the underlying mathematics of the game. One of the most debated topics in our community is the utility of Expected Goals (xG) timing: should you base your trades on the data from the first 45 minutes, or wait for the second-half trends to emerge?
The answer isn’t as simple as picking one over the other. Instead, it’s about understanding how the predictive power of xG shifts as the clock ticks toward the 90th minute. In this guide, we’ll break down the statistical differences between halves and show you how to use Predictology’s tools to find market inefficiencies.

The Statistical Reality: Why the Second Half Dominates
If you’ve spent any time looking at historical football data, you know that goals are not distributed evenly across a match. Statistically, the second half is significantly more productive than the first.
Breaking Down the Goal Volume
Data across the major European leagues shows a consistent pattern: 55% to 60% of all goals occur in the second half. On average, we see approximately 1 goal in the first half compared to 1.5 goals in the second.
This increase is driven by three primary factors:
- Player Fatigue: As defenders tire, technical errors increase, and defensive lines lose their cohesion.
- Tactical Adjustments: Managers often make aggressive substitutions after the 60th minute to chase a result.
- Game State Urgency: Teams trailing late in the game are forced to take more risks, leaving more space for counter-attacks.

Because there is a higher frequency of goals in the second half, the xG accumulated during this period often has a more direct correlation to actual goals. However, that doesn’t mean the first-half data is useless. In fact, it’s your most valuable lead indicator.
Predictive Power: Does 1st Half xG Predict 2nd Half Goals?
The real “secret sauce” in in-play trading is using first-half performance to predict second-half outcomes. This is where most traders fail: they look at the halftime score (0-0) and assume the game is “dead.”
The “Pressure Gauge” Effect
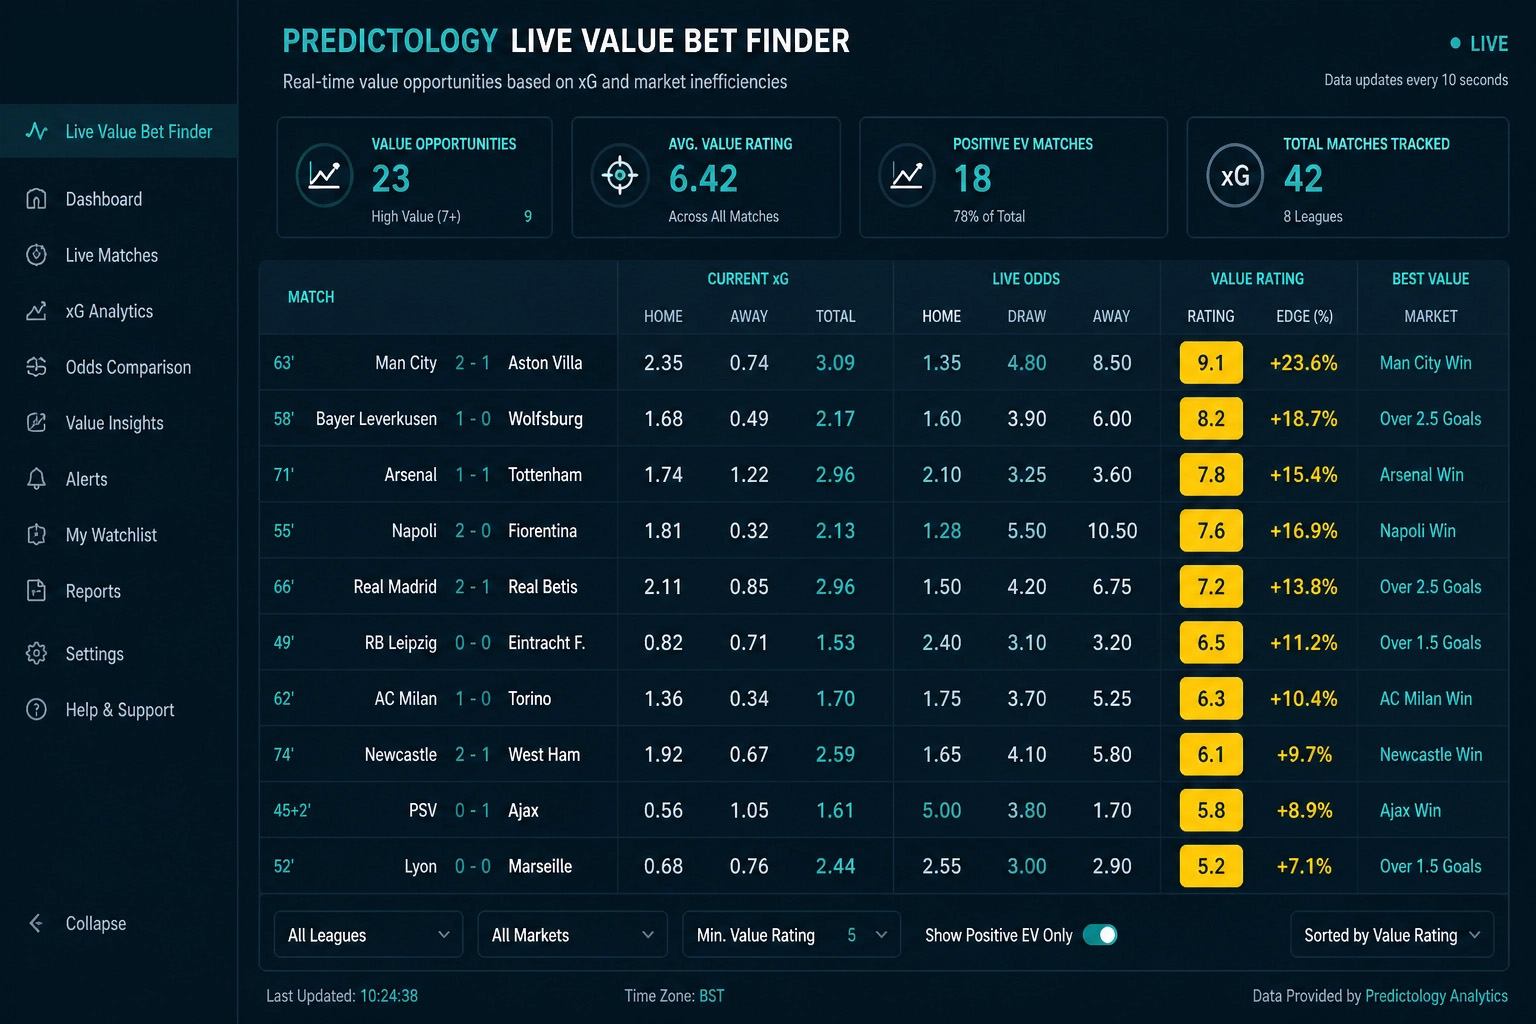
At Predictology, we view 1st half xG as a “pressure gauge.” If a match is 0-0 at halftime but the accumulated xG is 1.1 or higher, the market often underprices the probability of a goal in the second half. The odds drift because the scoreline remains static, but the underlying data suggests that high-quality chances are being created.
Statistically, a match that is 0-0 at halftime with a high xG has a significantly higher probability of at least one second-half goal (often exceeding 80%) compared to a 0-0 game where the xG is low (0.2 – 0.4). By identifying these mismatches, you can find high-value entries in the Over 0.5 or Over 1.5 goal markets before the price corrects.

Game State: The Hidden Variable
To master in-play trading, you must understand Game State. This is the current score of the match and how it influences team behavior. xG data is not “static”; it is heavily influenced by who is winning and who is losing.
Leading vs. Trailing
When a favorite is trailing at home in the 60th minute, their xG output typically spikes. Conversely, a team leading 3-0 may see their xG flatline as they move into a “preservation” mode, keeping the ball but not taking risks.
The most profitable in-play opportunities occur when the market overreacts to the game state. For example, if a heavy favorite is drawing 1-1 and their xG is rising sharply, the “Draw” price might be too low because the market isn’t accounting for the massive pressure being applied. Using the Live Value Bet Finder allows you to see these discrepancies in real-time.
Practical Trading Strategies Using Predictology
So, which is better? The answer is: 1st Half xG is better for finding value entries, while 2nd Half xG is better for confirming high-probability exits.
Here is a 3-step process to combine them:
- The Filter: Use the System Builder to find matches with a high historical tendency for second-half goals.
- The Entry: At halftime, check the xG. If the xG is high ( >1.0) but the score is low (0-0 or 1-0), look for an entry in the goal markets between the 50th and 60th minute.
- The Confirmation: Once in the trade, monitor the live xG. If the trailing team’s xG continues to climb, hold the position. If the xG flattens, consider trading out for a guaranteed profit.
The Verdict
While second-half xG is a more accurate reflection of final goal outcomes due to the sheer volume of late-game action, first-half xG is the superior tool for value identification.
Professional trading isn’t about predicting what will happen; it’s about identifying when the probability of an event is higher than what the odds suggest. By using the first 45 minutes as your research phase, you can enter the second half with a mathematical edge that the average bettor simply doesn’t have.
Practical Takeaway: Next time you see a 0-0 at halftime, don’t ignore it. Log into your Predictology dashboard, check the xG pressure, and see if the market has “fallen asleep” on a game that is primed for goals.
Want to start building your own data-driven models? Check out our LaunchPad educational resources to master the art of football analytics.


Join the Discussion
We respect your privacy — your email won’t be shown. Fields marked * are required.