October 24, 2026
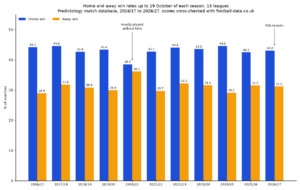
Home Advantage in 2026/27 vs the Last 10 Seasons
How strong is home advantage this season? Home, draw and away win rates in 13 leagues so far in 2026/27,...
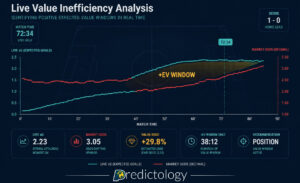
Expected Value (+EV); in the world of professional sports trading, the difference between a casual punter and a long-term profitable bettor isn’t luck: it’s the ability to identify market inefficiencies. An inefficient market occurs when the available price (the odds) does not accurately reflect the true probability of an event occurring. When you find a price higher than the true probability suggests it should be, you have found Positive Expected Value (+EV).

Finding these edges consistently requires a shift in mindset. You are no longer “picking winners”; you are pricing risk and identifying mathematical discrepancies. This guide outlines five actionable steps to move away from guesswork and toward a data-driven approach that exploits the gaps left by bookmakers and the general public.
The single most important metric for any serious punter is Closing Line Value (CLV). The “closing line” is the final set of odds offered by bookmakers right before a match kicks off. Because the market has had the maximum amount of time to absorb information: lineups, weather, betting volume, and expert consensus: the closing line is widely considered the most efficient representation of a match’s true probability.
If you consistently place bets at odds of 2.10, and the market closes at 1.90, you have “beaten the closing line.” Mathematically, you have secured a better price than the most efficient market consensus. Over thousands of bets, consistently beating the closing line is the primary indicator of a profitable strategy. If your average entry price is higher than the average closing price, you will almost certainly be in profit over the long run, regardless of individual match results.
To spot inefficiencies, you must identify markets that are likely to move. This involves tracking odds early in the week and comparing them to historical data. If your analysis suggests a team should be priced at 1.80, but the early market offers 2.05, you have identified a potential inefficiency.
The betting market is not a cold, calculating machine; it is driven by human participants who are susceptible to psychological biases. One of the most persistent inefficiencies in football betting is the Favorite-Longshot Bias. The general public loves to back favorites and “safe” outcomes, often driving the price of favorites down to a point where they no longer offer value.
In major leagues like the Premier League, elite teams often carry a “premium.” Because casual fans will bet on them regardless of the odds, bookmakers can afford to offer slightly worse prices. Conversely, this often leaves significant value on the underdog or the draw. Our research into the psychology of the draw shows that the market frequently underestimates the likelihood of a stalemate, especially when a heavy favorite is playing away from home.
Similarly, the Home Bias remains a factor. While home advantage is real, the market often overcorrects for it. By using data-driven models to calculate the “true” home advantage: factoring in travel distance, crowd density, and historical performance: you can find matches where the home team is priced as if they are unbeatable, when the statistics suggest a much tighter contest.

Traditional statistics like “goals scored” or “recent form” are lagging indicators. They tell you what happened, but they don’t necessarily tell you how well a team played. To find inefficiencies, you must use leading indicators like Expected Goals (xG) and Expected Points (xPTS).
A classic market inefficiency occurs when a team has been “unlucky.” Perhaps they have lost three games in a row, but their xG data shows they dominated possession and created high-quality chances while conceding goals from low-probability shots. The general public looks at the three losses and avoids them. The bookmaker reacts to the betting volume and drifts the price.
However, the serious punter sees a team that is statistically due for a regression to the mean. By backing the “unlucky” team at inflated odds, you are exploiting a market that has overreacted to short-term results while ignoring underlying performance metrics.
The more “eyes” there are on a market, the more efficient it becomes. The English Premier League or the Champions League Final are incredibly efficient because thousands of professional syndicates and high-tech models are constantly hammering the odds into their correct place.
If you want to find larger inefficiencies, you need to look where others aren’t. Lower divisions, secondary European leagues, or niche markets like Asian Handicaps often provide more +EV opportunities.
In a niche league, a single piece of news: such as the absence of a key defender or a change in the manager’s tactical approach: may take hours to be reflected in the odds. In the Premier League, that same news is priced in within seconds. By specializing in a specific league or market, you can achieve information asymmetry, where you know more about the specific conditions of a match than the bookmaker’s generalist algorithms.

Spotting an inefficiency once is luck; spotting it consistently is a system. To be a serious punter, you cannot rely on gut feeling. You must use tools like the Predictology System Builder to backtest your hypotheses against historical data.
Let’s say you believe that “Away underdogs who haven’t scored in two games are undervalued.” Instead of betting on that hunch today, you should run that criteria through a database of 400,000+ matches.
By creating a winning betting strategy based on hard data, you remove the emotional volatility of betting. You aren’t worried if a single bet loses because you know the underlying probability of the system is sound. A system that has proven to be profitable over 500 matches is a powerful tool for identifying future market inefficiencies.

Market inefficiencies aren’t “glitches”; they are the result of human emotion, information lag, and the bookmaker’s need to balance their books. To find +EV value, stop looking for who will win and start looking for where the price is wrong.
Your Next Steps:
By following these five steps, you transition from a casual bettor to a professional sports analyst, ensuring that every penny you put into the market is backed by a statistical advantage.
October 24, 2026
How strong is home advantage this season? Home, draw and away win rates in 13 leagues so far in 2026/27,...
October 24, 2026
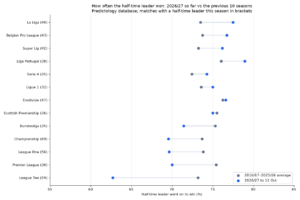
How often do half-time leads hold? Win, draw and defeat rates for half-time leaders in 13 leagues so far in...
October 24, 2026
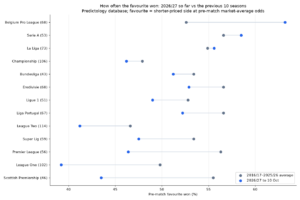
Favourites, draws and goals in 2026/27 so far compared with the previous 10 seasons across 13 leagues, from the Predictology...
October 24, 2026
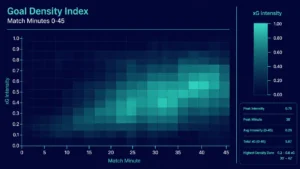
Expected Goals (xG); many recreational bettors spend their Saturday afternoons fixated on the final whistle. They track full-time results, late...
October 24, 2026
In the world of football betting, 2026 marks a significant turning point. Just a few years ago, Expected Goals (xG)...
October 24, 2026
How strong is home advantage this season? Home, draw and away win rates in 13 leagues so far in 2026/27,...
October 24, 2026
How often do half-time leads hold? Win, draw and defeat rates for half-time leaders in 13 leagues so far in...
October 24, 2026
Favourites, draws and goals in 2026/27 so far compared with the previous 10 seasons across 13 leagues, from the Predictology...
October 24, 2026
Expected Goals (xG); many recreational bettors spend their Saturday afternoons fixated on the final whistle. They track full-time results, late...
October 24, 2026
In the world of football betting, 2026 marks a significant turning point. Just a few years ago, Expected Goals (xG)...
Join the Discussion
We respect your privacy — your email won’t be shown. Fields marked * are required.