October 17, 2026
How Often Do Half-Time Leads Hold? 2026/27 vs the Last 10 Seasons
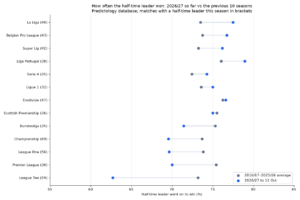
How often do half-time leads hold? Win, draw and defeat rates for half-time leaders in 13 leagues so far in...
In the world of football betting, 2026 marks a significant turning point. Just a few years ago, Expected Goals (xG) was the “secret sauce” of professional traders: a metric that allowed the analytically minded to stay three steps ahead of the bookmakers and the casual betting public. If you knew a team was generating high-quality chances despite a string of 0-0 draws, you had a license to print value.
Update, 14 October 2026: Autobet, which sent Predictology picks to BF Bot Manager, stops on 17 October 2026. The Bot Manager and automated-betting steps in this article won’t work with Predictology after that. Everything else in Predictology works as before.
Today, that landscape has shifted. Walk into any sports bar or scroll through social media during a Premier League weekend, and you’ll see xG maps, shot charts, and “unlucky” team narratives everywhere. The data is now mainstream. Television broadcasts display live Expected Goals totals alongside the scoreline, and bookmakers have integrated sophisticated Expected Goals modeling directly into their pricing algorithms.
The result? The market is more efficient than ever. Relying on standard Expected Goals data alone is no longer an “edge”: it is simply the baseline requirement for not losing your shirt. To find a true competitive advantage in 2026, you have to realize that xG is only half the story. The other half is context, validation, and Expected Value (+EV) filtering.
Standard xG tells you what should have happened based on the quality of shots taken. It is a fantastic descriptive tool, but it is not a prophetic one. Many bettors fall into the “xG Trap,” where they treat a high xG output as a guarantee of future performance. This leads to two major issues in a modern betting environment:
To move beyond the basics, you need to stop looking at xG as a standalone answer and start using it as a raw ingredient in a much larger machine.
The first step to gaining an edge in 2026 is moving from observation to validation. It’s one thing to notice a trend; it’s another to prove that the trend is actually profitable over thousands of matches.
This is where the Predictology System Builder becomes your most potent weapon. Instead of guessing that “high xG teams in the Bundesliga are undervalued,” you can test that exact theory against our database of over 400,000 matches.

When you run an xG-based model through the System Builder, you’re looking for the Standard Deviation of Success. Does this strategy work in the English Championship, or are the markets there too sharp? Does it hold up when the odds are between 1.80 and 2.20, or does the value only exist in the underdog price ranges?
By layering xG data with historical league performance, home/away splits, and specific odds movements, you transform a “hunch” into a statistically significant model. This process helps you avoid the common mistakes of overfitting, ensuring that your strategy is built on a solid foundation of long-term probability, not just recent noise.
If xG tells you the probability of a goal, the +EV Strategy Builder tells you the profitability of a bet. These are two very different things.
In 2026, a team can have a 60% chance of winning based on their xG dominance, but if the bookmaker has priced them at 1.50 (implied 66.7%), that bet is -EV (Negative Expected Value). You will lose money in the long run by placing that bet, regardless of how good the xG stats look.
Predictology’s +EV Strategy Builder allows you to filter through over 20,000 tracked bets to find the specific “value pockets” where the market has failed to price the xG correctly.

When you combine these layers, your ROI (Return on Investment) shifts from the break-even doldrums of manual betting to the consistent growth seen in professional-grade portfolios. You aren’t just betting on “good teams”; you are betting on mispriced opportunities.
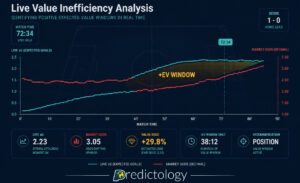
The final piece of the 2026 puzzle is execution. Because markets move so quickly, the value identified by xG models can disappear in seconds. This is especially true in-play, where a sudden spike in Expected Goals (e.g., three big chances in five minutes) can lead to a “Live Value” opportunity before the bookmaker adjusts the “Next Goal” or “Over/Under” markets.
The Live Value Bet Finder at Predictology monitors these shifts 24/7. It acts as your eyes and ears, scanning thousands of matches simultaneously to find instances where the Live xG Trend deviates significantly from the pre-match expectations and current odds.
For many of our members, the next logical step is moving from manual to machine. By connecting your Predictology strategies to the BF Bot Manager, you can automate your betting entirely. This removes the psychological fatigue of monitoring games and ensures that every +EV opportunity is captured at the best possible price, regardless of the time of day.

In 2026, betting on football is no longer about who has the best “opinion” or who watches the most games. It is about who has the best process.
Standard xG is an essential tool, but it is only the starting point. To truly excel, you must:
Stop treating xG like a crystal ball. Start treating it like the raw data point it is, and use the full suite of Predictology tools to turn that data into a professional betting portfolio.
If you’re ready to move beyond the basics, your practical takeaway is this: Audit your current strategy. Take your last 50 bets and see how many were placed solely because of a “good xG” narrative, and how many had a documented +EV edge. If you can’t answer that, it’s time to head over to the Predictology LaunchPad and start building your first data-driven system.
October 17, 2026
How often do half-time leads hold? Win, draw and defeat rates for half-time leaders in 13 leagues so far in...
October 17, 2026
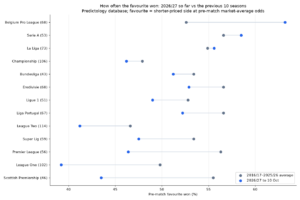
Favourites, draws and goals in 2026/27 so far compared with the previous 10 seasons across 13 leagues, from the Predictology...
October 17, 2026
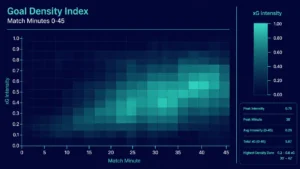
Expected Goals (xG); many recreational bettors spend their Saturday afternoons fixated on the final whistle. They track full-time results, late...
October 17, 2026
Expected Value (+EV) For the majority of football bettors, the live market is a whirlwind of emotion, reaction, and guesswork....
October 17, 2026
System Builder; for most football bettors, the journey starts with a gut feeling. You see a home team with a...
October 17, 2026
How often do half-time leads hold? Win, draw and defeat rates for half-time leaders in 13 leagues so far in...
October 17, 2026
Favourites, draws and goals in 2026/27 so far compared with the previous 10 seasons across 13 leagues, from the Predictology...
October 17, 2026
Expected Goals (xG); many recreational bettors spend their Saturday afternoons fixated on the final whistle. They track full-time results, late...
October 17, 2026
Expected Value (+EV) For the majority of football bettors, the live market is a whirlwind of emotion, reaction, and guesswork....
October 17, 2026
System Builder; for most football bettors, the journey starts with a gut feeling. You see a home team with a...
Join the Discussion
We respect your privacy — your email won’t be shown. Fields marked * are required.