July 28, 2026
Beyond the Full-Time Result: Profiting from 1st Half Goals and xG Trends
Expected Goals (xG); many recreational bettors spend their Saturday afternoons fixated on the final whistle. They track full-time results, late...
Live xG; for decades, in-play football trading was guided by a combination of the “eye test” and a handful of basic statistics provided by bookmakers. Traders would look at possession percentages, the number of corners, and the total count of shots to determine which team was “on top.”
However, as the sports betting markets have become more efficient, these traditional metrics are increasingly proving insufficient. The modern trader requires more than just a summary of what has happened; they need a predictive insight into what is likely to happen. This is where Expected Goals (xG) has shifted from a post-match analytical tool to a real-time trading necessity.
At Predictology, we focus on the intersection of data science and betting technology. Understanding the nuance between descriptive stats and predictive models is the hallmark of a professional trader. In this guide, we will break down why Live xG is fundamentally changing the landscape of in-play trading and how it compares to the traditional statistics you see on every live score app.
Traditional match statistics are the data points most familiar to the casual punter. They are easy to digest and provide a snapshot of the match history. But for a trader, they often represent “lagging indicators”: information that tells you where the match has been, rather than where it is going.
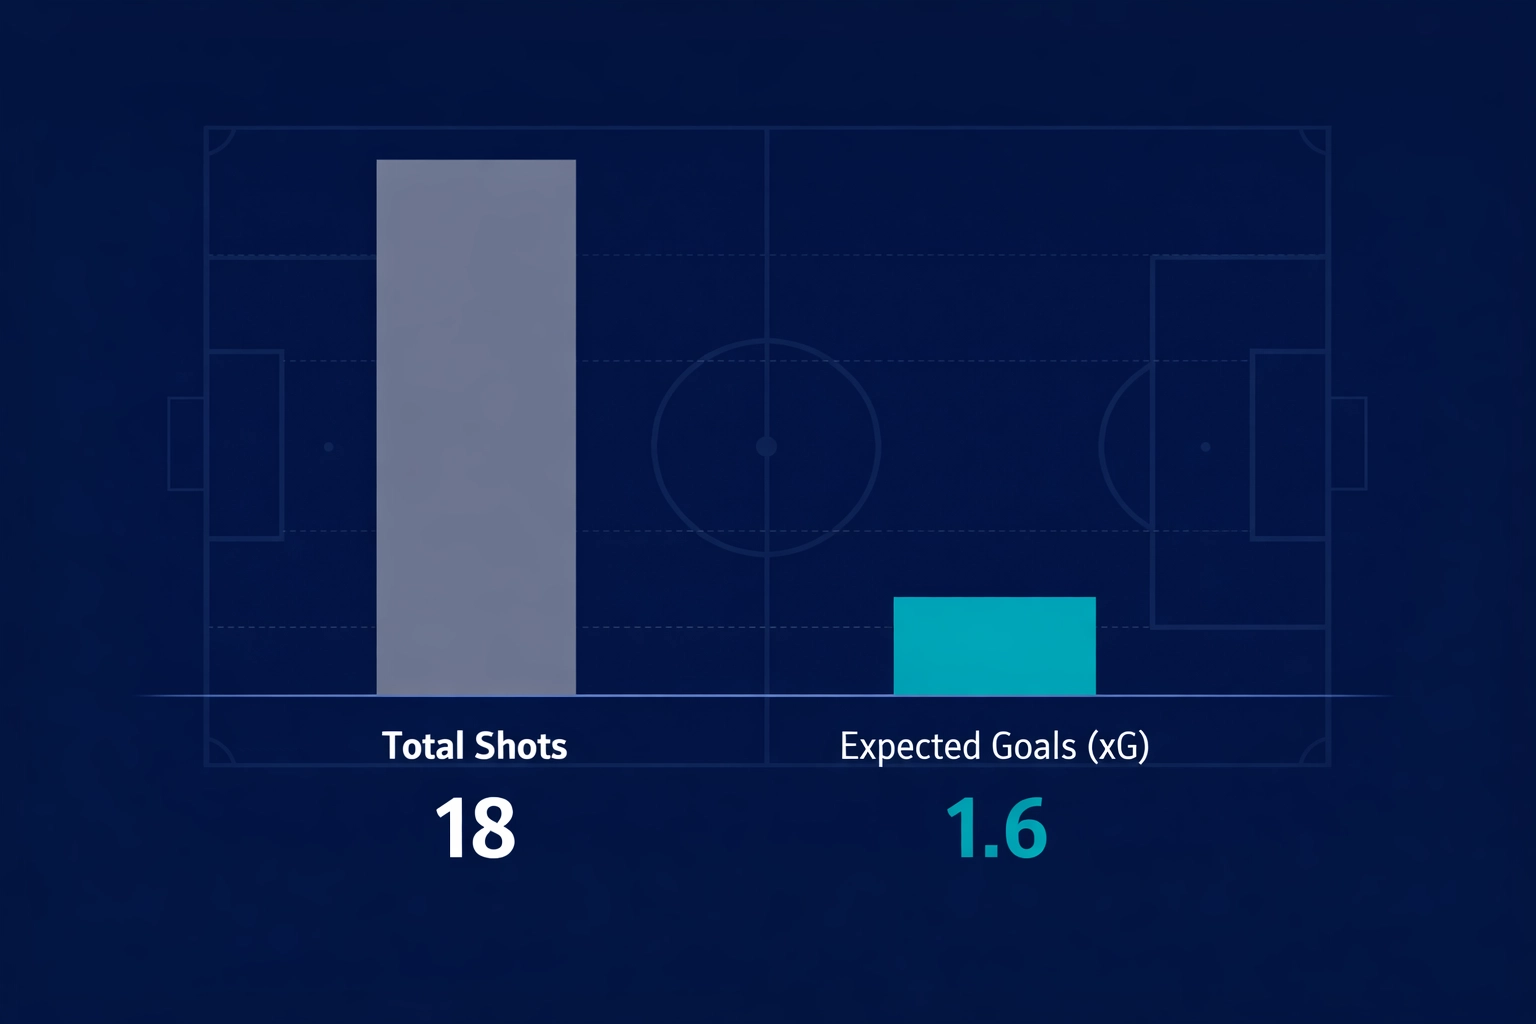
The most common traditional metrics used in-play are total shots, shots on target, and “dangerous attacks.” While these suggest offensive intent, they are notoriously lack context.
For example, a team might have 15 shots on goal, but if 12 of those were speculative long-range efforts from 30 yards out, their actual chance of scoring remains low. Conversely, a team with only 2 shots: both from within the six-yard box: is technically much closer to finding the back of the net. Traditional stats treat all shots with roughly the same weight, leading to a skewed perception of team dominance.
Possession is perhaps the most overvalued metric in traditional analysis. A team like Manchester City might maintain 70% possession, but in an in-play scenario, high possession often leads to lower market odds for that team.
The danger for a trader is that “sterile possession”: keeping the ball in the middle third without penetrating the box: does not necessarily correlate with goal-scoring probability. Relying solely on possession figures can lead to “value traps” where you back a team that looks dominant on paper but is actually struggling to create high-quality openings.
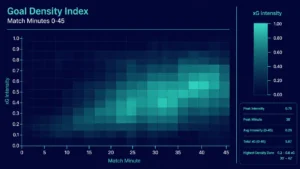
Expected Goals (xG) is a probability-based metric that assigns a value (between 0 and 1) to every shot taken in a match. This value represents the likelihood of that specific shot resulting in a goal, based on historical data from hundreds of thousands of similar shots.
Unlike a simple “shot on target” stat, Live xG takes into account a wide array of variables in real-time, including:
When these variables are calculated during a live match, they provide a “Live xG” total. This allows traders to see if a team is creating genuine, high-quality chances or simply inflating their stats with low-probability efforts. For those looking to refine their approach, understanding how to create a winning in-play football betting strategy starts with selecting the right data inputs.
To understand which is better for your trading, we have to look at how they perform in specific in-play scenarios.
One of the greatest edges in football trading is identifying when a scoreline does not reflect the reality of the match. Traditional stats might show a team leading 1-0 while losing the corner count 8-1 and the shot count 10-2. A traditional trader might assume the trailing team is about to equalize.
However, if the Live xG shows the leading team at 1.45 xG and the trailing team at 0.40 xG, it tells a different story. It suggests the trailing team is taking many low-quality shots, while the leading team is clinical and creating better chances. Live xG exposes “lucky” leads and “undeserved” deficits, allowing you to avoid backing a team that is merely “huffing and puffing” without real threat.
Traditional stats describe what has already happened. xG predicts what is likely to happen next. In-play trading is essentially a game of anticipating price movements.
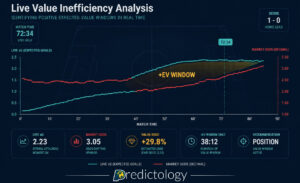
If you see a team’s Live xG climbing rapidly while the score remains 0-0, the mathematical probability of a goal is increasing. Often, the betting market is slightly slower to react to xG accumulation than it is to a “Dangerous Attack” notification. By monitoring live xG, you can often enter a “Goal Line” or “Match Odds” position before the market price collapses.
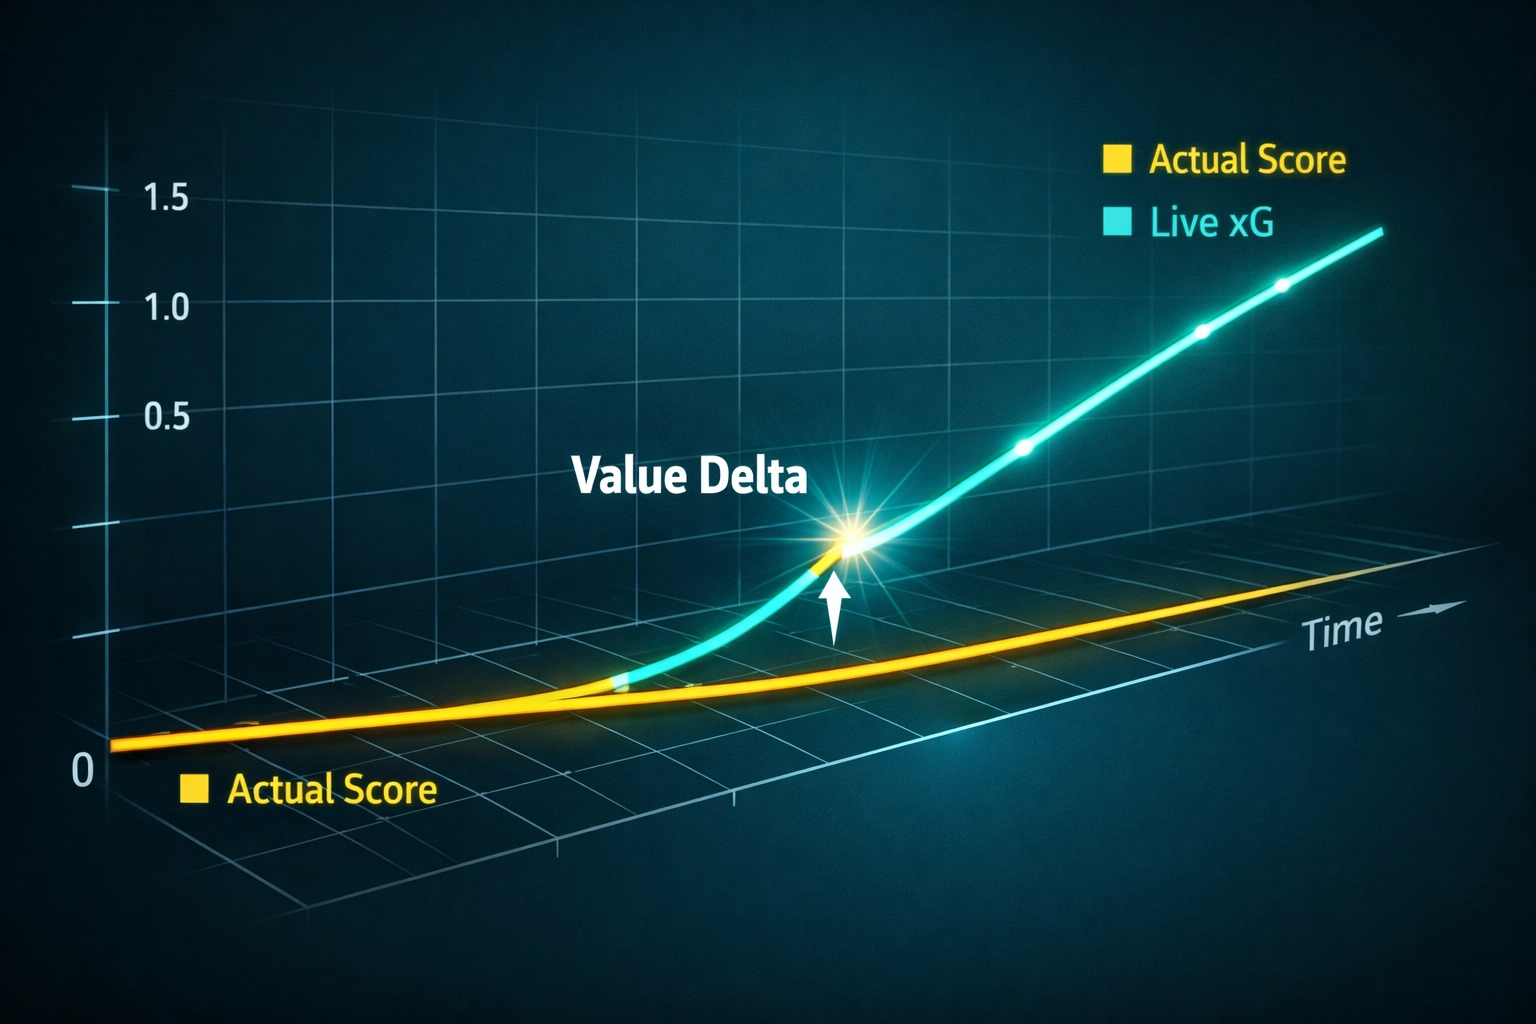
The betting market is heavily influenced by the scoreline and basic volume stats. This creates inefficiencies. If a high-profile team is losing but their xG is significantly higher than their opponent’s (e.g., 2.1 xG vs 0.3 xG), the odds on them to win or draw will often be inflated because the market is reacting to the score.
Statistical “regression to the mean” suggests that over time, actual goals will align with expected goals. As a trader, you are looking for the “delta”: the gap between the score and the xG. When that gap is wide, you have found a potential value trade. This concept is a cornerstone of building a betting system that beats the closing line.
While Live xG is superior in many ways, it is not a magic bullet. Professional traders must be aware of its limitations:
The most successful in-play traders don’t choose one over the other; they use a hybrid approach. They use traditional stats to understand the tempo of the game and Live xG to understand the quality.
When evaluating an in-play trade, compare the two data sets:
For the serious in-play trader, Live xG is the superior metric. It provides an objective, data-driven assessment of chance quality that traditional stats simply cannot match. It strips away the noise of speculative shots and meaningless possession, leaving you with a clear picture of which team is actually creating the best opportunities to score.
However, data is only as good as the platform you use to analyze it. At Predictology, we provide the tools and insights necessary to turn these statistical theories into profitable trading systems. Whether you are building automated bots or trading manually, incorporating xG into your workflow is no longer optional: it is a requirement for maintaining a long-term edge.
Practical Takeaway:
Next time you are trading in-play, don’t just look at who has the most shots. Look at the xG accumulation. If you see a team with an xG of 1.5+ that hasn’t scored yet, the market may be underpricing the “Over 0.5 Goals” or “Team Total” markets. This is where the value lives.
Ready to take your data analysis to the next level? Explore our latest insights and tutorials to see how you can integrate advanced metrics into your daily trading routine.
July 28, 2026
Expected Goals (xG); many recreational bettors spend their Saturday afternoons fixated on the final whistle. They track full-time results, late...
July 28, 2026
In the world of football betting, 2026 marks a significant turning point. Just a few years ago, Expected Goals (xG)...
July 28, 2026
Expected Value (+EV) For the majority of football bettors, the live market is a whirlwind of emotion, reaction, and guesswork....
July 28, 2026
System Builder; for most football bettors, the journey starts with a gut feeling. You see a home team with a...
July 28, 2026
Analytics; to move from a casual punter to a professional bettor, you must transition from making “picks” to executing a...
July 28, 2026
Expected Goals (xG); many recreational bettors spend their Saturday afternoons fixated on the final whistle. They track full-time results, late...
July 28, 2026
In the world of football betting, 2026 marks a significant turning point. Just a few years ago, Expected Goals (xG)...
July 28, 2026
Expected Value (+EV) For the majority of football bettors, the live market is a whirlwind of emotion, reaction, and guesswork....
July 28, 2026
System Builder; for most football bettors, the journey starts with a gut feeling. You see a home team with a...
July 28, 2026
Analytics; to move from a casual punter to a professional bettor, you must transition from making “picks” to executing a...


Join the Discussion
We respect your privacy — your email won’t be shown. Fields marked * are required.