July 26, 2026
Beyond the Full-Time Result: Profiting from 1st Half Goals and xG Trends
Expected Goals (xG); many recreational bettors spend their Saturday afternoons fixated on the final whistle. They track full-time results, late...
If you’ve spent any time in the sports betting world over the last five years, you’ve heard of Expected Goals (xG). What started as a niche metric used by data nerds and professional scouts has exploded into the mainstream. It’s on Match of the Day, it’s all over Twitter, and it’s fundamentally changed how we look at football.
But here is the thing: most bettors only look at xG as a post-match post-mortem. They use it to complain about how “unlucky” their bet was because their team won the xG battle but lost the actual game.
At Predictology, we don’t use data to find excuses. We use it to find value.
The real power of Expected Goals isn’t in looking backward; it’s in its ability to tell us what is likely to happen next while a match is still live. If you can master the use of advanced metrics for in-play trading, you’re no longer just guessing based on the “feel” of a game: you’re trading based on mathematical probability.
The scoreboard is a liar. That might sound dramatic, but in the short term, football is a high-variance, low-scoring game. A team can be absolutely dominating: pinning their opponent in their own box, creating chance after chance: only to concede a fluke goal on a counter-attack.
If you are trading in-play based solely on the score, you are missing the underlying reality of the match.
Most in-play traders look at “Shots on Target” or “Possession.” While these are better than nothing, they are often misleading.
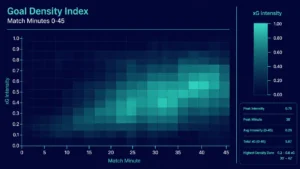
Expected Goals solves this by assigning a value (from 0 to 1) to every single shot based on its quality. A penalty is roughly 0.76 xG because, historically, 76% of penalties are scored. A header from a difficult angle under pressure might be 0.03 xG.
By aggregating these values in real-time, we get a much clearer picture of which team is actually creating the better chances.
This is one of the most profitable ways to use Expected Goals in-play. We are looking for matches where there is a significant divergence between the xG and the actual scoreline.
Imagine a scenario: Manchester City are playing at home against a mid-table side. It’s the 60th minute, and the score is 0-0.
In this scenario, the probability of a goal occurring is significantly higher than the current odds might suggest. The market often overreacts to the passage of time and the lack of goals. By using xG, you can identify that the pressure is sustainable and that a goal is statistically “overdue.”
For more on building these kinds of systems, check out our guide on how to build and test your own profitable football betting systems.
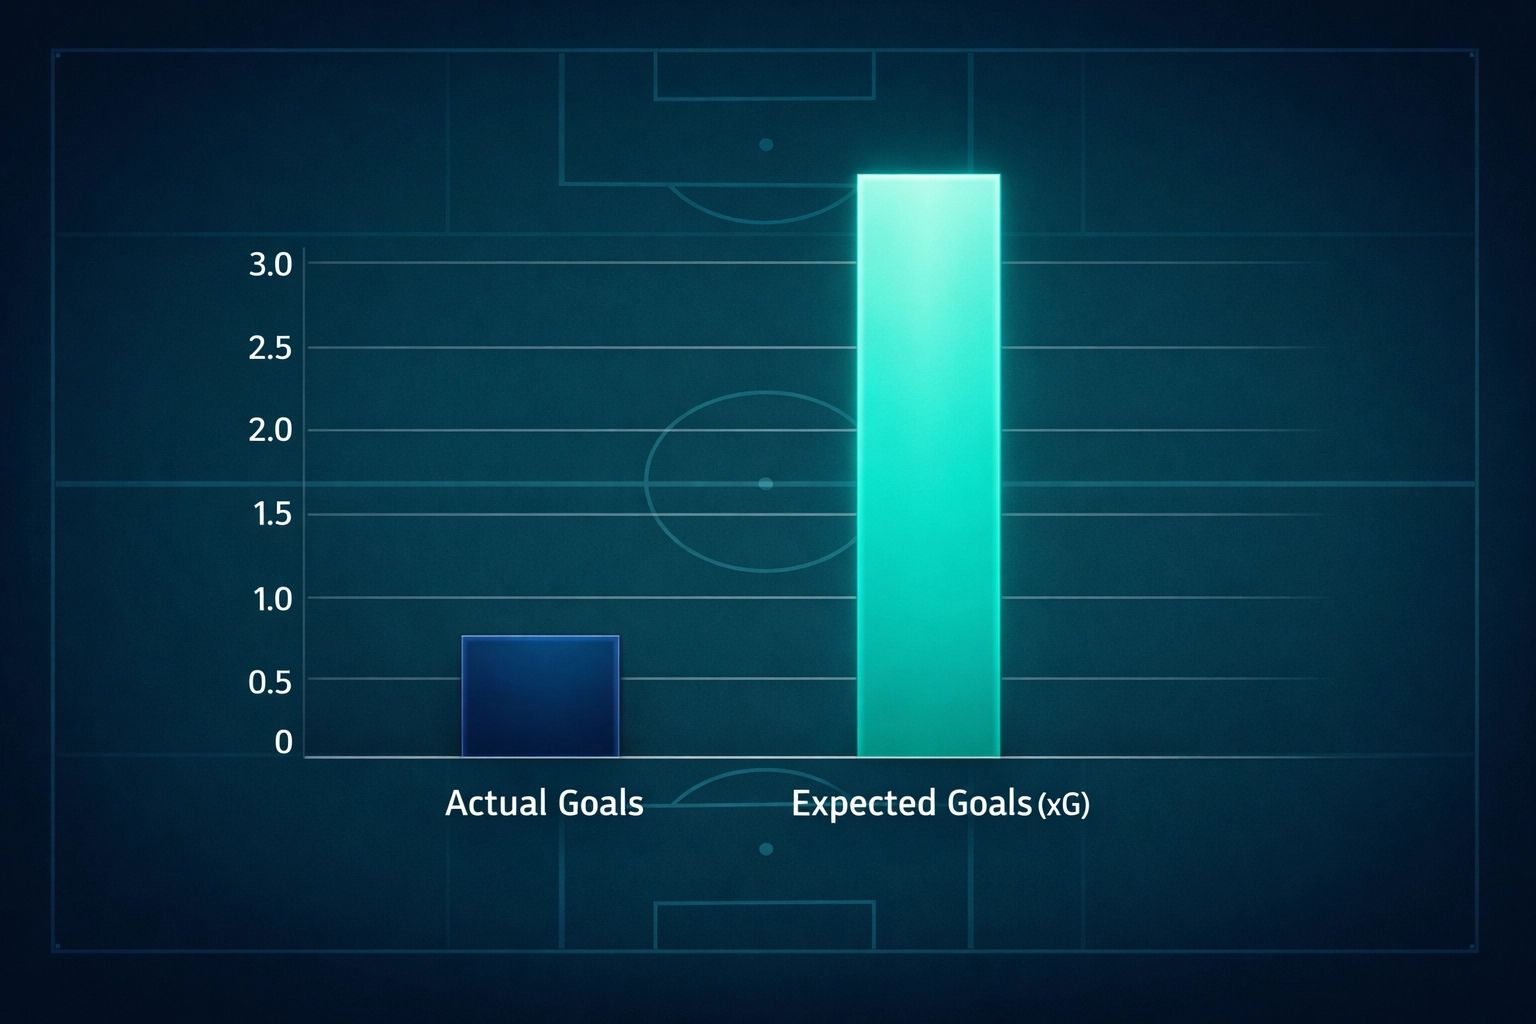
We’ve all seen it. A team is getting battered for 30 minutes, they cross the halfway line for the first time, score a scruffy goal, and lead 1-0.
The market often reacts by slashing the odds on the team now leading. However, if the xG shows the leading team has 0.05 xG while the trailing team has 1.20 xG, the value lies in backing the trailing team to get something out of the game.
When a team is leading despite poor xG metrics, they are relying on two things:
Neither of these is usually sustainable over 90 minutes. If you see a team leading 1-0 at halftime but the xG is 0.10 vs 1.50, the “Draw” or the “Trailing Team Next Goal” market often offers massive Expected Value (EV).
Understanding the maths of winning and EV is crucial here. You aren’t betting that the trailing team will definitely score; you are betting that the odds being offered are higher than the statistical probability of them scoring.
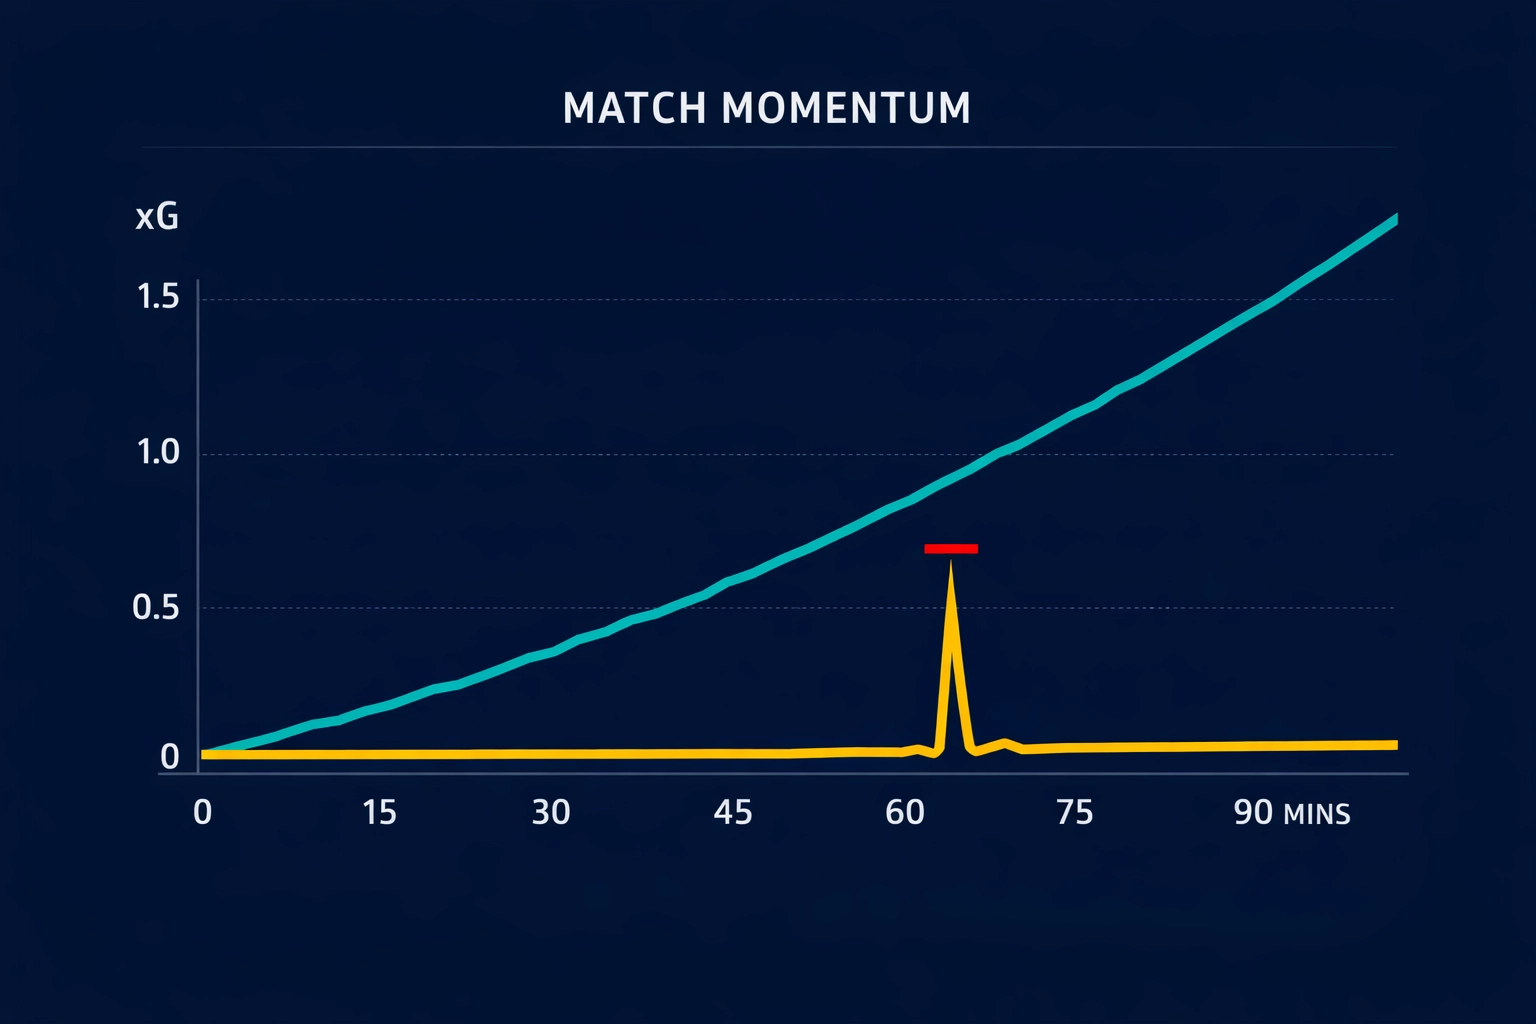
In-play trading is all about timing. Watching the xG trend is just as important as the total number. At Predictology, we look for “Momentum Bursts.”
If a game has been quiet for 45 minutes (low xG for both sides), but the first 10 minutes of the second half see a spike of 0.80 xG for the home team, the game state has changed. Tactical adjustments at halftime often lead to these spikes.
Key In-Play Metrics to Watch:
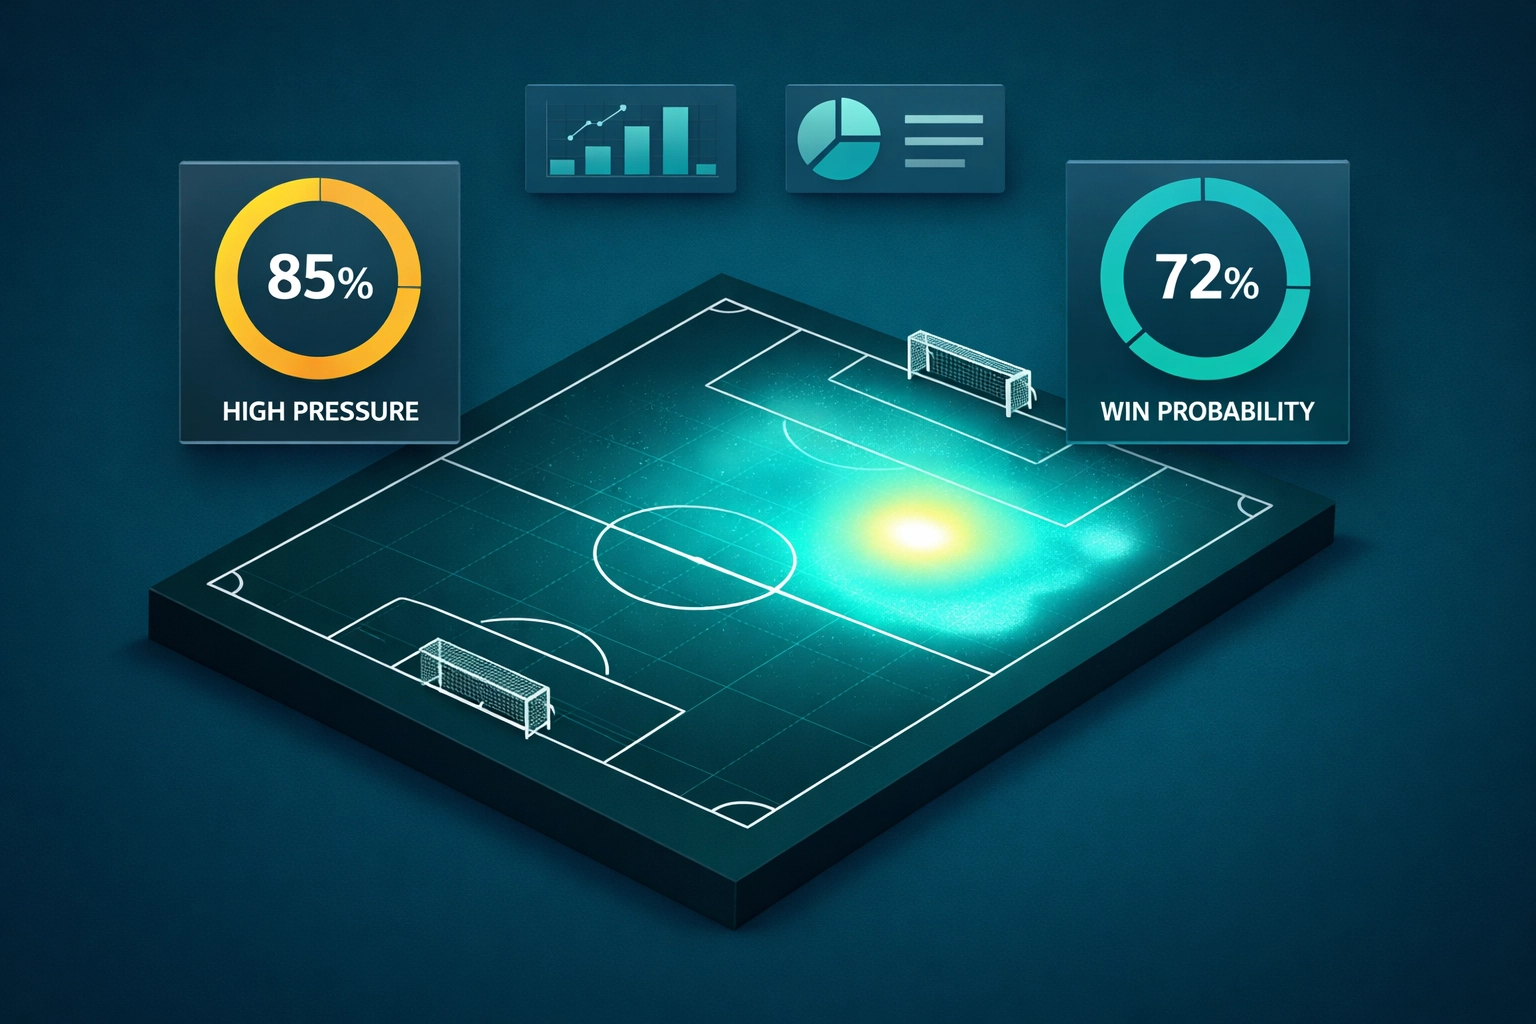
“Game State” refers to whether a team is winning, losing, or drawing. This is the single biggest factor affecting xG.
When a favorite goes 1-0 down, their xG usually rockets as they commit more men forward. Conversely, the leading underdog’s xG usually stalls as they sit deep to protect the lead.
When analyzing in-play xG, always ask: “Is this xG high because the team is playing well, or simply because the game state is forcing them to attack?”
If a favorite is losing and their xG is still low, that is a massive red flag. It suggests they have no idea how to break down the opposition, and the “Lay” on the favorite becomes a very strong play.
The problem with in-play trading is that it’s exhausting. You can’t watch 20 games at once and track the Expected Goals of each. This is where automation becomes your best friend.
By using the data models available at Predictology, you can set filters to alert you when specific xG conditions are met across dozens of leagues simultaneously.
Imagine getting a notification that says: “Match: Everton vs Wolves. Minute 70. Score 0-0. Home xG > 1.8. Odds for Home Win > 2.50.”
This allows you to move away from emotional betting and toward a professional guide to finding value 24/7. Automation ensures you never miss a high-probability trade because you were busy watching a different game.
While Expected Goals are powerful, it isn’t a crystal ball. You must be aware of its limitations:
To start using Expected Goals in your trading today, follow this simple workflow:
By integrating these metrics into your routine, you’re moving from being a gambler to being a sports analyst. The markets are getting smarter, and the only way to stay ahead is to use the same data the pros use.
Ready to take your data-driven betting to the next level? Explore our features and data models to see how we can help you find the edge.
July 26, 2026
Expected Goals (xG); many recreational bettors spend their Saturday afternoons fixated on the final whistle. They track full-time results, late...
July 26, 2026
In the world of football betting, 2026 marks a significant turning point. Just a few years ago, Expected Goals (xG)...
July 26, 2026
Expected Value (+EV) For the majority of football bettors, the live market is a whirlwind of emotion, reaction, and guesswork....
July 26, 2026
System Builder; for most football bettors, the journey starts with a gut feeling. You see a home team with a...
July 26, 2026
Analytics; to move from a casual punter to a professional bettor, you must transition from making “picks” to executing a...
July 26, 2026
Expected Goals (xG); many recreational bettors spend their Saturday afternoons fixated on the final whistle. They track full-time results, late...
July 26, 2026
In the world of football betting, 2026 marks a significant turning point. Just a few years ago, Expected Goals (xG)...
July 26, 2026
Expected Value (+EV) For the majority of football bettors, the live market is a whirlwind of emotion, reaction, and guesswork....
July 26, 2026
System Builder; for most football bettors, the journey starts with a gut feeling. You see a home team with a...
July 26, 2026
Analytics; to move from a casual punter to a professional bettor, you must transition from making “picks” to executing a...


Join the Discussion
We respect your privacy — your email won’t be shown. Fields marked * are required.