November 11, 2026
Promoted Teams’ First Eight Games: 2026/27 vs the Last 10 Seasons
How this season's 24 promoted clubs have started in nine leagues, compared with the 238 promoted in the previous ten...
Which scores come up most in football, and is this season any different? With most of these leagues paused for the November international break (League One and League Two play on Saturday 14 November), we counted the full-time score of all 1,481 league matches played in 13 leagues up to Sunday 8 November 2026 and compared them with the same stretch of the previous ten seasons: the 15,588 league matches played between the start of each season and 8 November, from 2016/17 to 2025/26. The leagues are the Premier League, Championship, League One, League Two, La Liga, Serie A, Bundesliga, Ligue 1, Eredivisie, Liga Portugal, Scottish Premiership, Belgian Pro League and Süper Lig.
Home team’s goals first. The ten-season share covers the same stretch of each season (start of the season to 8 November).
| Score | Matches 2026/27 | Share 2026/27 | Share 2016/17–2025/26 | Rank over ten seasons |
|---|---|---|---|---|
| 1-1 | 150 | 10.1% | 12.0% | 1 |
| 2-1 | 134 | 9.0% | 9.1% | 3 |
| 1-0 | 128 | 8.6% | 9.9% | 2 |
| 2-2 | 108 | 7.3% | 5.5% | 8 |
| 1-2 | 104 | 7.0% | 7.1% | 6 |
| 2-0 | 102 | 6.9% | 7.1% | 5 |
| 0-1 | 98 | 6.6% | 7.7% | 4 |
| 0-0 | 84 | 5.7% | 6.8% | 7 |
| 0-2 | 65 | 4.4% | 4.9% | 9 |
| 3-0 | 60 | 4.1% | 4.0% | 10 |
| 3-1 | 58 | 3.9% | 4.0% | 11 |
| 1-3 | 47 | 3.2% | 2.7% | 12 |
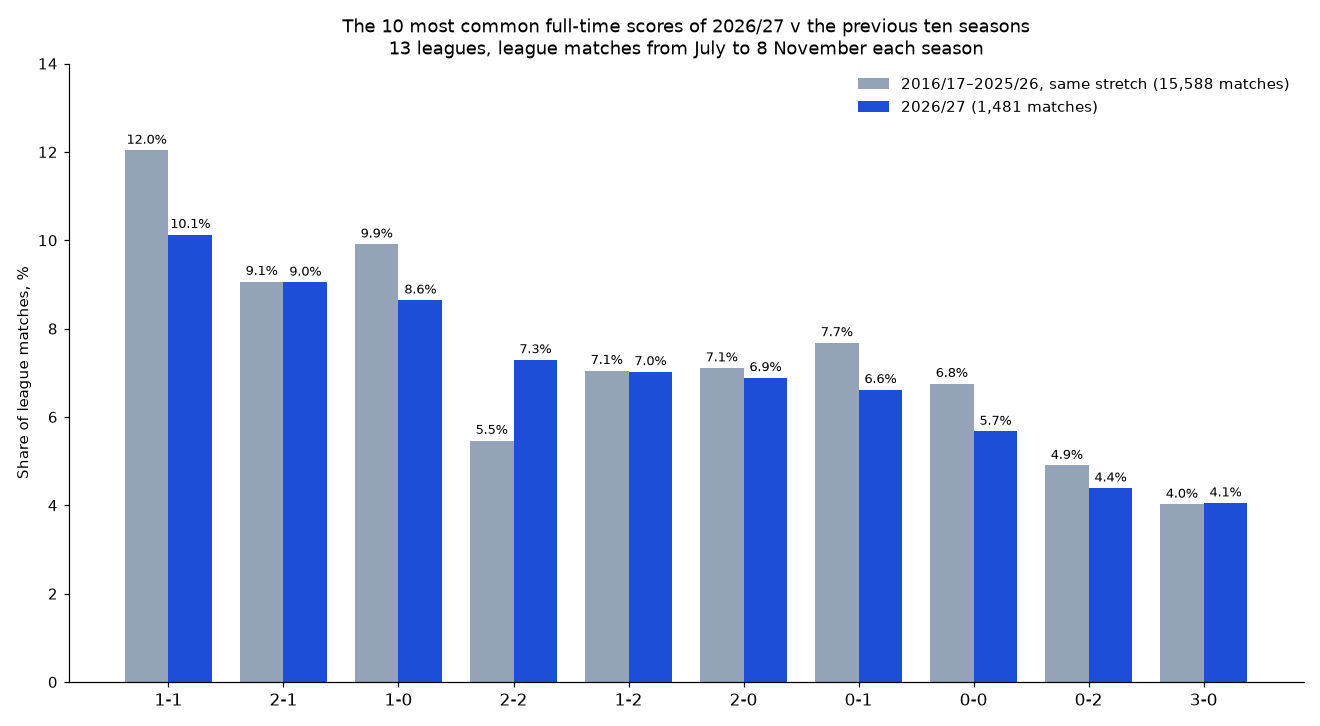
The usual home-and-away pattern still holds: 8.6% of matches ended 1-0 against 6.6% for 0-1, and 9.0% ended 2-1 against 7.0% for 1-2. Across the ten full seasons (48,414 matches) the top three were 1-1 (12.0%), 1-0 (9.7%) and 2-1 (8.9%), so the early-season stretch isn’t unusual in itself.
45 different scores have come up so far. Four matches had nine goals: Sheffield Wednesday 7-2 Bromley in League One, Barcelona 7-2 Racing Santander in La Liga, Excelsior 0-9 Twente in the Eredivisie (the biggest winning margin of the season) and Cardiff 5-4 Burnley in the Championship on 7 November. Manchester United and Aston Villa drew 4-4 on 8 November, one of four 4-4 draws this season.
Each row covers league matches from the start of that season to 8 November.
| Season | Matches | Goals a match | 1-1 | 1-0 | 0-0 | 2-2 | Top 5 scores |
|---|---|---|---|---|---|---|---|
| 2016/17 | 1,571 | 2.66 | 13.4% | 9.2% | 7.4% | 5.3% | 48.1% |
| 2017/18 | 1,602 | 2.74 | 10.1% | 10.6% | 6.4% | 4.8% | 45.6% |
| 2018/19 | 1,596 | 2.71 | 12.4% | 10.5% | 7.2% | 5.4% | 45.6% |
| 2019/20 | 1,580 | 2.73 | 12.1% | 9.9% | 6.9% | 6.6% | 45.6% |
| 2020/21 | 1,164 | 2.73 | 13.0% | 9.2% | 6.7% | 4.3% | 45.9% |
| 2021/22 | 1,685 | 2.75 | 13.4% | 9.1% | 6.4% | 6.5% | 46.7% |
| 2022/23 | 1,867 | 2.72 | 11.5% | 10.2% | 6.5% | 4.7% | 48.2% |
| 2023/24 | 1,549 | 2.84 | 10.7% | 8.7% | 6.5% | 5.7% | 43.4% |
| 2024/25 | 1,452 | 2.71 | 11.7% | 11.0% | 7.8% | 5.0% | 46.4% |
| 2025/26 | 1,522 | 2.68 | 12.4% | 10.4% | 5.8% | 6.0% | 47.6% |
| 2026/27 | 1,481 | 2.99 | 10.1% | 8.6% | 5.7% | 7.3% | 42.1% |
2020/21 has fewer matches because ten of the 13 leagues started that season in September, after the pandemic-delayed end of 2019/20.
Over the ten seasons, 1-1 was the most common score at this point of the season in every one of the 13 leagues. This season it is top, or joint top, in only five: the Championship, League One, League Two, La Liga and the Scottish Premiership.
| League | Matches | Most common score 2026/27 | 1-1 2026/27 | 1-1 ten seasons | 0-0 2026/27 | 0-0 ten seasons |
|---|---|---|---|---|---|---|
| Premier League | 100 | 0-1 (12 of 100) | 11.0% | 11.7% | 6.0% | 6.2% |
| Championship | 180 | 1-1 (20 of 180) | 11.1% | 13.2% | 6.1% | 7.5% |
| League One | 158 | 1-1 (22 of 158) | 13.9% | 12.1% | 8.2% | 6.1% |
| League Two | 164 | 1-1 (27 of 164) | 16.5% | 12.3% | 7.3% | 7.5% |
| La Liga | 119 | 1-1 (15 of 119) | 12.6% | 13.7% | 10.1% | 7.9% |
| Serie A | 110 | 2-1 (13 of 110) | 9.1% | 10.1% | 1.8% | 7.4% |
| Bundesliga | 81 | 2-1 and 2-2 (7 of 81 each) | 3.7% | 11.6% | 7.4% | 5.7% |
| Ligue 1 | 90 | 2-1 (10 of 90) | 7.8% | 12.5% | 6.7% | 6.7% |
| Eredivisie | 108 | 2-2 (16 of 108) | 9.3% | 11.2% | 0.9% | 4.1% |
| Liga Portugal | 98 | 1-0 (14 of 98) | 6.1% | 12.1% | 5.1% | 6.9% |
| Scottish Premiership | 75 | 1-1 and 2-1 (9 of 75 each) | 12.0% | 9.8% | 2.7% | 7.3% |
| Belgian Pro League | 99 | 3-0 (10 of 99) | 6.1% | 11.7% | 3.0% | 6.0% |
| Süper Lig | 99 | 1-2 (10 of 99) | 4.0% | 12.5% | 5.1% | 7.7% |
League samples are small, roughly 75 to 180 matches each, so one or two results move these shares a lot. The 13-league totals above are a much steadier guide.
A correct-score price is easier to judge once you turn the share into odds. As a worked example: a score that comes up in 12.0% of matches, as 1-1 has over the ten seasons, has a fair price of about 8.3 before any bookmaker’s margin (1 divided by the share). This season’s 10.1% works out at about 9.9, and 2-2’s 7.3% at about 13.7, against about 18.3 for its ten-season share. League-wide shares are only a starting point: a single match’s score depends on the two teams, so most correct-score bettors start from team-level numbers such as goals scored and conceded.
Predictology’s System Builder lets you build your own betting strategies from over 400,000 matches in more than 80 leagues, with 100+ variables, so you can check how an angle has held up over many seasons before you rely on it.
Start your £1 Predictology trial (£1 for 7 days, then £37 a month; cancel any time)
More from this series: the 2026/27 season so far against the last 10 seasons, half-time leads, home advantage, first-half v second-half goals and promoted teams’ first eight games.
Source: Predictology match database, full-time results, cross-checked against football-data.co.uk. This season’s figures cover league matches played up to 8 November 2026, with every half-time and full-time score cross-checked against football-data.co.uk and FootyAmigo’s results. The ten-season figures use the 48,414 regular league matches from 2016/17 to 2025/26 where our database and football-data.co.uk agree on the half-time and full-time score; a few awarded results, play-off matches and matches missing from either source are left out. Past results don’t guarantee future results. 18+ only. Please gamble responsibly and only stake what you can afford to lose. Free, confidential help is available at www.begambleaware.org.
November 11, 2026
How this season's 24 promoted clubs have started in nine leagues, compared with the 238 promoted in the previous ten...
November 11, 2026
When do the goals come this season? First-half and second-half goals in 13 leagues so far in 2026/27, compared with...
November 11, 2026
How strong is home advantage this season? Home, draw and away win rates in 13 leagues so far in 2026/27,...
November 11, 2026
How often do half-time leads hold? Win, draw and defeat rates for half-time leaders in 13 leagues so far in...
November 11, 2026
Favourites, draws and goals in 2026/27 so far compared with the previous 10 seasons across 13 leagues, from the Predictology...
November 11, 2026
How this season's 24 promoted clubs have started in nine leagues, compared with the 238 promoted in the previous ten...
November 11, 2026
When do the goals come this season? First-half and second-half goals in 13 leagues so far in 2026/27, compared with...
November 11, 2026
How strong is home advantage this season? Home, draw and away win rates in 13 leagues so far in 2026/27,...
November 11, 2026
How often do half-time leads hold? Win, draw and defeat rates for half-time leaders in 13 leagues so far in...
November 11, 2026
Favourites, draws and goals in 2026/27 so far compared with the previous 10 seasons across 13 leagues, from the Predictology...
Join the Discussion
We respect your privacy — your email won’t be shown. Fields marked * are required.