July 17, 2026
Beyond the Full-Time Result: Profiting from 1st Half Goals and xG Trends
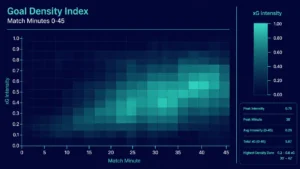
Expected Goals (xG); many recreational bettors spend their Saturday afternoons fixated on the final whistle. They track full-time results, late...
Backtesting Betting Strategies; we’ve all been there. You spend hours, maybe even days, scouring through historical football data. You’re looking for that one edge, that specific set of variables that yields a steady upward curve on a profit graph. Finally, you find it. A combination of home form, Expected Goals (xG) differentials, and specific league filters that shows a 20% ROI over the last three seasons.
You feel like you’ve cracked the code. You start placing bets, expecting the money to roll in, only to watch your bankroll slowly erode as the strategy fails to perform in the “real world.”
What happened? You didn’t lack the data, and your logic wasn’t necessarily flawed. You likely fell victim to overfitting.
The good news is that there is one simple trick that professional analysts at Predictology use to separate “lucky” backtests from genuine winning systems. By implementing this one structural change to how you handle data, you can drastically improve your success rate when building a betting system.
Before we get to the solution, we have to understand the problem. In the world of sports analytics, the biggest enemy isn’t a lack of information; it’s the tendency to find patterns where none exist. This is known as overfitting.
When you are backtesting betting strategies, you are essentially looking at a closed loop of historical events. If you tweak your filters enough, adding a rule here about weather, or a rule there about a specific referee, you can make any historical dataset look profitable. However, you aren’t finding a market inefficiency; you are simply describing the “noise” of the past.
Overfitting happens because the human brain is wired to find order in chaos. If a strategy shows a loss in October, it’s tempting to add a filter that says, “Don’t bet in October.” But unless there is a statistical reason why October is different from November, you’ve just overfitted your model to a random variance in the data.
A “perfect” backtest is actually a red flag. If your strategy has a 90% win rate and zero drawdowns over 500 games, it is almost certainly overfitted. Markets are efficient; finding an edge is about identifying a 2% to 5% advantage over the closing price, not discovering a magic formula that never loses. To build a robust system, you need to stop chasing the perfect line and start building for durability.
The single most effective way to improve your backtesting is to split your data.
Most amateur bettors use their entire available dataset to build and refine their strategy. Professionals do the opposite. They divide their data into two distinct sets:
The “trick” is simple: If your strategy performs brilliantly on your in-sample data but falls off a cliff on your out-of-sample data, your strategy is overfitted and will fail in live markets.
A standard approach is the 70/30 split. If you have ten years of Premier League data:
Crucially, you are only allowed to run the out-of-sample test once. If it fails, you don’t go back and “tweak” the variables to make it work on the out-of-sample data, because then that data simply becomes part of your in-sample set, and you’re back to square one with overfitting.
For a deeper dive into the technical setup of these systems, check out our guide on how to build a winning football system.
If you want to take your backtesting betting strategies to the next level, you should move beyond a simple split and use Walk-Forward Analysis.
Instead of one large split, you create multiple smaller windows. For example:
This method simulates the “real world” experience of betting. It forces the strategy to adapt to changing league dynamics, such as the rise of high-pressing tactics or changes in VAR implementation. If a strategy remains profitable across multiple “walk-forward” windows, you have something statistically significant.

Data is addictive. When you have access to the Predictology database, it’s easy to get carried away with the number of variables you test. However, there is a mathematical limit to how much “tweaking” a strategy can handle before it loses its predictive power.
Research in quantitative finance and sports modeling suggests two key limits:
When building a betting system, simplicity is your friend. A simple model that relies on fundamental data, like xG or shot conversion rates, is much more likely to survive the transition from backtest to live betting than a complex model with dozens of obscure filters.
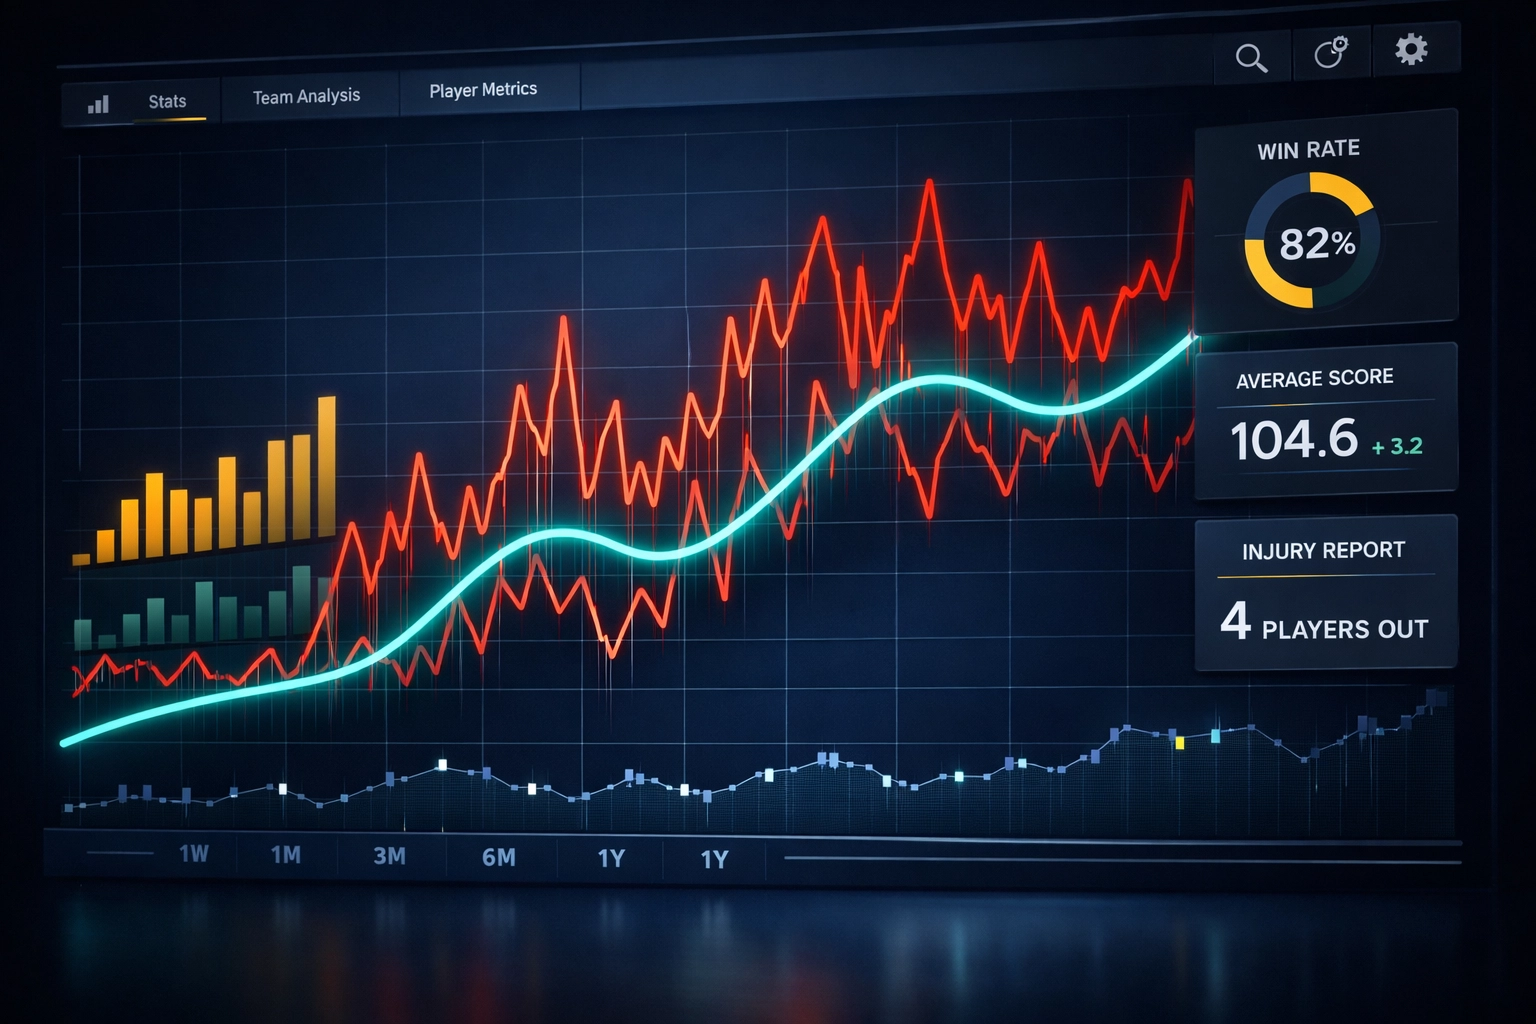
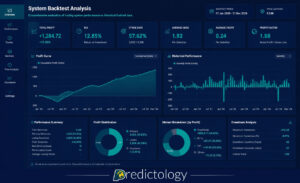
When most people look at a backtest report, they go straight to the “Net Profit” column. This is a mistake. Profit is a “vanity metric”, it tells you what happened, but it doesn’t tell you the risk you took to get there.
To truly understand if your strategy is robust, you need to track:
Originally used in the stock market, the Sharpe Ratio measures your return relative to the risk (volatility). In betting, a high Sharpe Ratio means your bankroll grows steadily without massive, heart-stopping swings.
This is the “stress test” for your psychology. If your backtest shows that at one point you lost 40% of your bankroll, you need to ask yourself: “Would I have had the discipline to keep betting after the 35th percent loss?” If the answer is no, the strategy is unusable, regardless of the final profit.
This is the gross profit divided by the gross loss. A profit factor of 1.20 means that for every $1.00 you lose, you make $1.20. Professional systems typically hover between 1.10 and 1.25. If you see a profit factor of 3.0, you are almost certainly looking at an overfitted model or a tiny sample size.
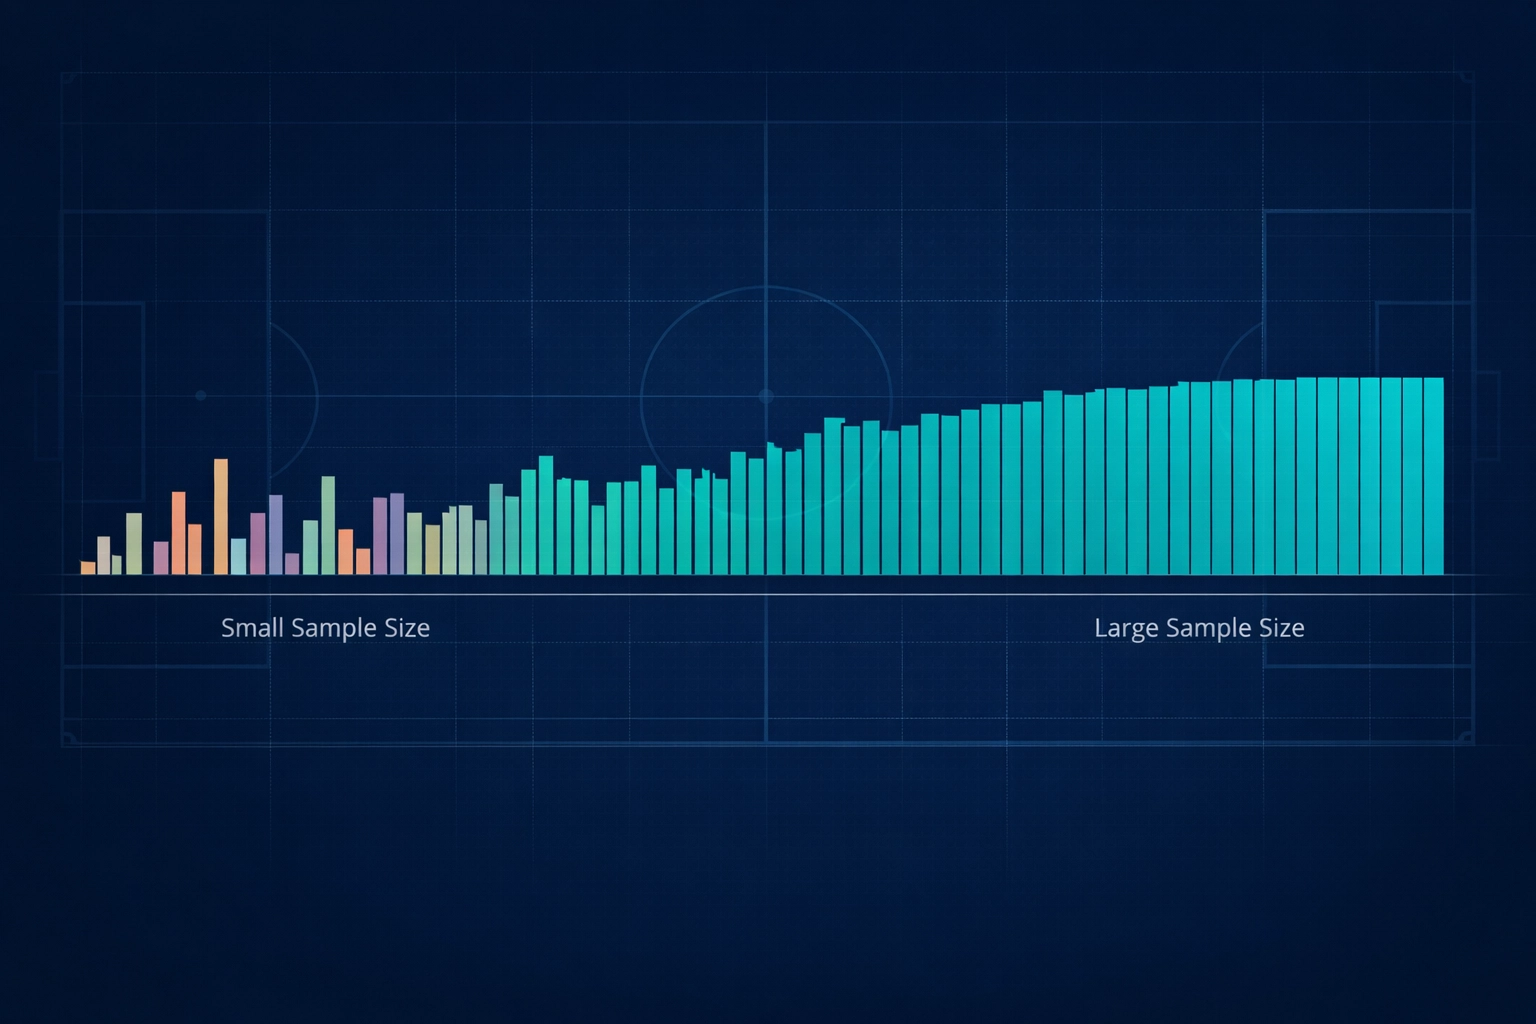
How many bets do you need before you can trust a strategy? 10? 50?
Statistically speaking, you need at least 30 trades to even begin making inferences. However, for a high-confidence conclusion, you should aim for over 100 trades in your out-of-sample testing phase.
If you test a strategy over 20 games and it shows a 20% ROI, there is actually a 20% probability that your results are down to nothing but random luck. When you scale that to 100 or 200 games, the “noise” starts to clear, and the true value of the strategy is revealed. This is why many Predictology members choose to automate their tested strategies using Predictology and BF Bot Manager: it allows for high-volume execution of statistically robust systems without emotional interference.
Improving your backtesting betting strategies doesn’t require a degree in mathematics. It requires discipline and a structured process.
If you are currently working on a strategy, here is your action plan:
The goal of backtesting isn’t to prove that you are right; it’s to try and prove that your strategy is wrong. Only when a system survives your best attempts to break it should you consider putting real money behind it.
Ready to start building? Access the world’s most comprehensive football database and professional-grade backtesting tools at Predictology.
July 17, 2026
Expected Goals (xG); many recreational bettors spend their Saturday afternoons fixated on the final whistle. They track full-time results, late...
July 17, 2026
In the world of football betting, 2026 marks a significant turning point. Just a few years ago, Expected Goals (xG)...
July 17, 2026
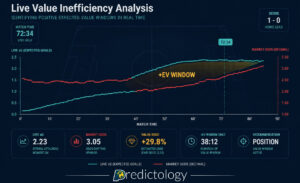
Expected Value (+EV) For the majority of football bettors, the live market is a whirlwind of emotion, reaction, and guesswork....
July 17, 2026
System Builder; for most football bettors, the journey starts with a gut feeling. You see a home team with a...
July 17, 2026
Analytics; to move from a casual punter to a professional bettor, you must transition from making “picks” to executing a...
July 17, 2026
Expected Goals (xG); many recreational bettors spend their Saturday afternoons fixated on the final whistle. They track full-time results, late...
July 17, 2026
In the world of football betting, 2026 marks a significant turning point. Just a few years ago, Expected Goals (xG)...
July 17, 2026
Expected Value (+EV) For the majority of football bettors, the live market is a whirlwind of emotion, reaction, and guesswork....
July 17, 2026
System Builder; for most football bettors, the journey starts with a gut feeling. You see a home team with a...
July 17, 2026
Analytics; to move from a casual punter to a professional bettor, you must transition from making “picks” to executing a...

Join the Discussion
We respect your privacy — your email won’t be shown. Fields marked * are required.