April 05, 2026
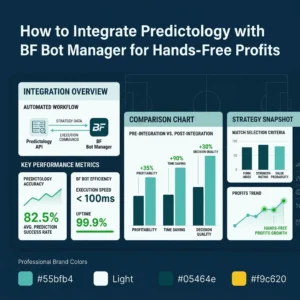
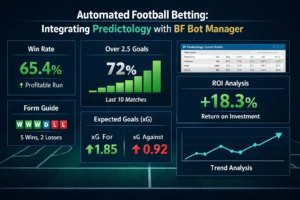
Betting Automation: How to Integrate Predictology with BF Bot Manager for Hands-Free Profits
Betting Automation; if you’ve spent any time in the world of professional betting, you know that the biggest enemy isn’t...
If you’ve spent more than five minutes in a football betting forum or scrolling through sports on X lately, you’ve seen it: xG. Some people swear by it like it’s the Holy Grail of betting; others dismiss it as “nerd stats” that don’t account for the “passion” of the game. At Predictology, we lean toward […]
If you’ve spent more than five minutes in a football betting forum or scrolling through sports on X lately, you’ve seen it: xG. Some people swear by it like it’s the Holy Grail of betting; others dismiss it as “nerd stats” that don’t account for the “passion” of the game.
At Predictology, we lean toward the data. But we also know that data is only as good as the person using it. Expected Goals (xG) has fundamentally changed how we look at soccer betting analytics, moving us away from looking at just the scoreline and toward looking at the quality of chances.
But can football xG stats actually help you “crush” the markets? Or is the bookie already three steps ahead of you? Let’s break down the reality of using xG to find value in the modern betting landscape.
Before we can use xG to make money, we have to understand what it actually is. In simple terms, Expected Goals (xG) is a statistical measure of the quality of a goal-scoring chance. It assigns a value to every shot taken on a scale between 0 and 1. A penalty, for example, typically has an xG of 0.76 because, historically, about 76% of penalties result in a goal. A long-range strike from 35 yards out might only have an xG of 0.02.
Modern football xG stats are calculated using massive datasets that account for several variables:
By aggregating these numbers over a full 90 minutes, we get a much clearer picture of which team “deserved” to win. If Team A wins 1-0 but the xG was 0.45 to 2.80 in favor of Team B, we know that Team A got lucky: and Team B likely has a performance level that isn’t yet reflected in the league table.

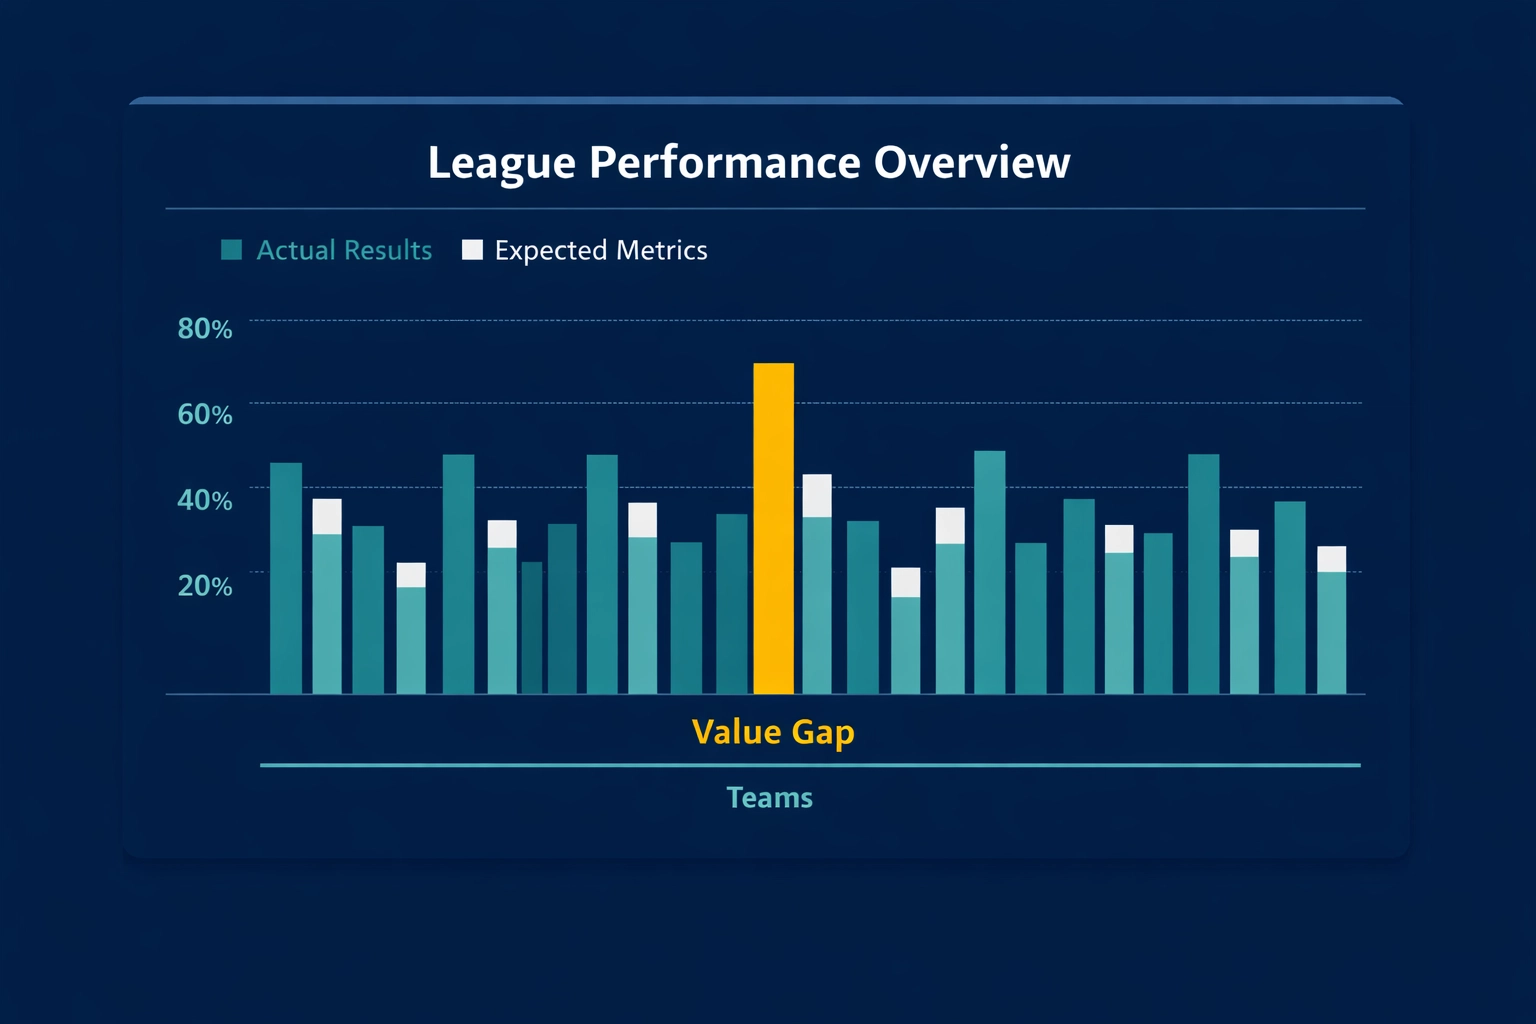
The core of any successful betting strategy is finding “value.” This happens when the probability of an outcome occurring is higher than the probability implied by the bookmaker’s odds. Soccer betting analytics via xG help us identify these gaps.
When actual results deviate significantly from xG, we see “variance.” Over the long run, results tend to regress toward the mean (the xG). This is where the money is made.
Take the match between Tottenham and Nottingham Forest in April 2025. On paper, the scoreline tells one story, but the xG stats tell a much more nuanced one. Tottenham generated 2.14 expected goals but walked away with only 1 goal. Meanwhile, Forest achieved a measly 0.48 xG but managed to put 2 in the back of the net.
To the casual bettor, Forest looked “clinical” or “brave.” To the data-driven analyst using Predictology, Tottenham was the dominant side that suffered from poor finishing or an inspired goalkeeper performance. In the next match, the market might undervalue Tottenham or overvalue Forest based on that result. By identifying this discrepancy, you can place bets on the team that is performing well but hasn’t seen the results yet.
So, how do you actually apply this to your weekend slip? You can’t just bet on the team with the higher xG every time and expect to retire early. You need a process.
One of the most effective ways to use football xG stats is in the Total Goals (Over/Under) markets. Instead of looking at a team’s last five scores, look at their “xG For” and “xG Against” over those games.
If two teams with high defensive xG (meaning they concede very few high-quality chances) are facing off, the “Under 2.5” market might offer value, even if their previous matches were high-scoring due to fluke goals or penalties. Conversely, if you see two teams consistently creating over 2.0 xG per game but struggling to convert, the “Over 2.5” market is likely ripe for a correction.
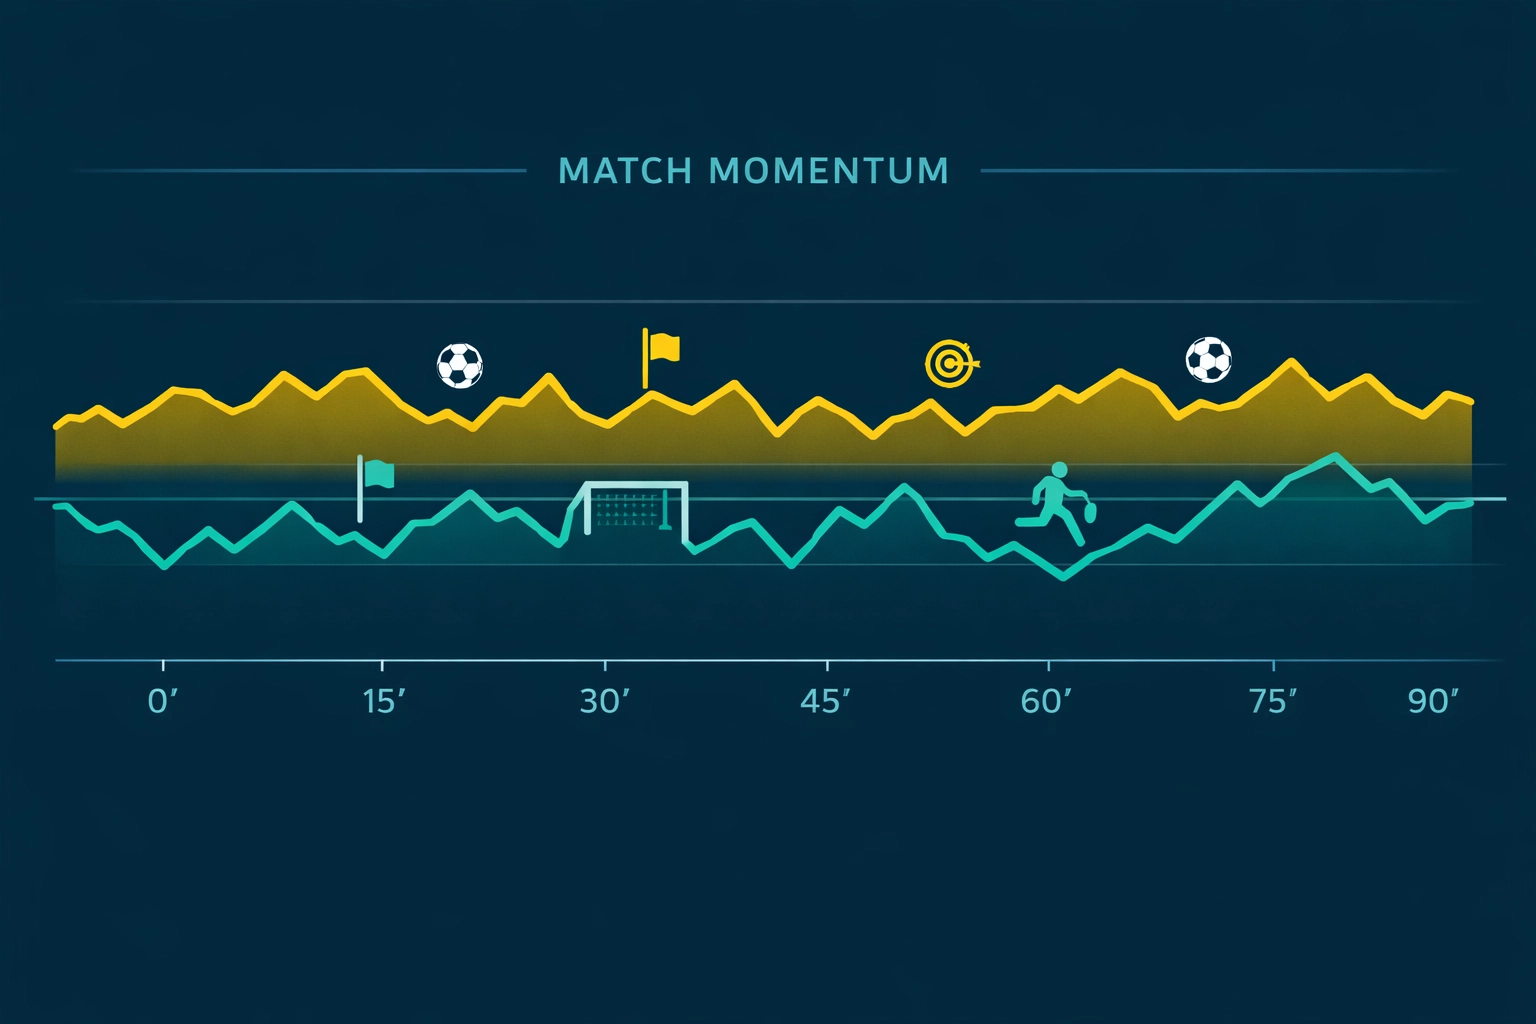
Live xG data is a game-changer. It allows you to gauge whether a team has an underlying superiority that hasn’t been reflected on the scoreboard yet. If a home favorite is 0-0 at half-time but has an xG of 1.5 while the visitor has 0.1, the “Home Win” odds will often be much higher than they were at kick-off. Because the data suggests the goal is coming, this is often a prime entry point for a value bet.
For those interested in automating these types of entries, integrating Predictology with BF Bot Manager is a great way to execute based on specific data triggers without having to watch every second of the match.
If xG were a guaranteed way to win, we’d all be millionaires. There are some very real limitations that every serious bettor needs to understand.
The biggest hurdle? Bookmakers use xG too. In fact, they use models far more complex than the free ones you find on social media. They use these metrics to set their opening lines and to adjust live odds. This means that a lot of the “xG value” is already priced into the market by the time you see it.
To beat the bookie, you need to find something their model might be missing: such as team news, motivation factors, or specific tactical mismatches that a pure shot-based xG model can’t capture.
A single match is full of noise. A team can have a high xG because of one “big chance” that was actually a goalmouth scramble, which might not be repeatable. Professional soccer betting analytics require a larger sample size. Usually, you want to look at a rolling average of 5 to 10 games to see a team’s true performance level.
If you want to learn more about how to test these theories over thousands of matches, check out our guide on backtesting betting strategies.
While xG is a fantastic starting point, it’s just one tool in the kit. To truly find an edge, you should combine xG with other advanced metrics:
At Predictology, we simplify this process. Our platform allows you to filter through thousands of matches using advanced data models that incorporate xG and other vital statistics. Instead of manually calculating whether a team is overperforming, you can use our features to identify these trends instantly across 50+ global leagues.
The goal isn’t to predict the score of every game; it’s to develop a consistent methodology that identifies when the market has made a mistake.
The answer is a resounding yes: but with caution. Football xG stats are arguably the best tool we have for measuring team quality, but they aren’t a crystal ball.
If you use xG to understand that a team’s 3-0 win was actually a lucky result against the run of play, you are already ahead of 90% of casual bettors. When you combine that insight with a disciplined staking plan and a robust backtesting system, you’re no longer gambling: you’re investing based on probability.
Your Practical Next Step:
Pick a league you follow closely. For the next three matchdays, compare the actual scorelines to the xG totals. Identify one team that is consistently “under-scoring” their xG and monitor their odds for the following week. You’ll soon see the “Value Gap” appearing right before your eyes.
Ready to take your analysis to the next level? Join the community of data-driven bettors and explore our pricing plans to get started with professional-grade tools today.
April 05, 2026
Betting Automation; if you’ve spent any time in the world of professional betting, you know that the biggest enemy isn’t...
April 05, 2026
Value Betting Models; if you’ve spent any time in the sports betting world, you’ve likely heard the term “value” thrown...
April 05, 2026
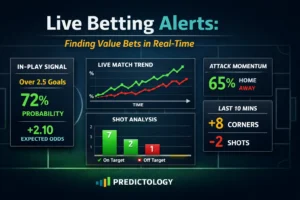
Live Betting Alerts; in the modern sports trading landscape, the pre-match markets are more efficient than ever. With thousands of...
April 05, 2026
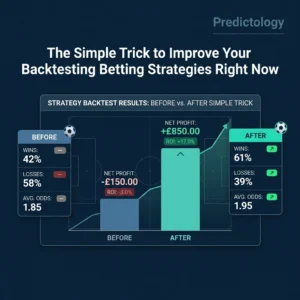
Backtesting Betting Strategies; we’ve all been there. You spend hours, maybe even days, scouring through historical football data. You’re looking...
April 05, 2026
Automated Football Betting; for many years, the primary barrier to professional-level football betting wasn’t just finding an edge; it was...
April 05, 2026
Betting Automation; if you’ve spent any time in the world of professional betting, you know that the biggest enemy isn’t...
April 05, 2026
Value Betting Models; if you’ve spent any time in the sports betting world, you’ve likely heard the term “value” thrown...
April 05, 2026
Live Betting Alerts; in the modern sports trading landscape, the pre-match markets are more efficient than ever. With thousands of...
April 05, 2026
Backtesting Betting Strategies; we’ve all been there. You spend hours, maybe even days, scouring through historical football data. You’re looking...
April 05, 2026
Automated Football Betting; for many years, the primary barrier to professional-level football betting wasn’t just finding an edge; it was...

Join the Discussion
We respect your privacy — your email won’t be shown. Fields marked * are required.